
Telemetry#
Constellation comes with a builtin system for gathering real-time monitoring data from the satellites in a running Constellation. This data is referred to as telemetry, and its individual data points are called metrics and represent a named, typed, numerical measurements that change over time. Typical examples are a temperature reading, a voltage, a data rate, or a counter of processed events.
See also
Details about how to implement telemetry and metrics can be found in the application development guide. A detailed technical description of the underlying protocol can be found in the protocol description chapter of the Framework Developer Guide.
Metrics#
A metric has three fixed attributes defined by the satellite that emits it:
Name: a short identifier in uppercase, such as
TEMPERATURE,CURRENT, orEVENT_RATE. The name is unique within any given satellite but the same name may appear across different satellites. This identifier is used to subscribe to a metric.Unit: the physical unit of the value as a plain string, such as
°C,A,Hz, or an empty string for dimensionless quantities. Some listeners receiving the metrics might use this to display values.Value: the measured quantity itself, provided in the specified units.
Timestamp: a point representing either the time of sending the metric, or the measurement time of the metric value. This depends on the sending satellite, but often these times coincide.
Description: a human-readable explanation of what this metric represents. The description is not emitted with every metric data point, but only upon subscription
Telemetry Subscriptions#
Telemetry data is distributed over the network via the CMDP protocol, the same protocol used for log messages. Both log messages and metric messages are published by satellites on the same socket, and listeners receive specific slices of information they are interested in by subscribing to the relevant topics.
A satellite will only create and transmit a metric if the is an active subscription from at least one listener in order to limit both network traffic and computational cost of performing the corresponding measurement on the sending side. Listeners can connect and disconnect as desired, or change which metrics they subscribes to, while the Constellation remains unperturbed.
Metric Intervals#
Metrics can be sent by satellites either in regular intervals, or whenever an event occurs, such as a change of the satellite finite state.
Metrics sent regularly are associated with a fixed interval. A temperature sensor might for example be polled every ten seconds, while an event counter might be sent every second. The emission interval is defined by the satellite implementation and the individual satellite descriptions in the Satellite Library document the available metrics and their intervals.
Metrics that are event-driven are emitted whenever the underlying value changes. The framework metrics STATE and RUN_ID
for example, emitted by every satellite, are published immediately on each change rather than on a fixed schedule.
Framework Metrics#
Every satellite in a Constellation emits a standard set of metrics automatically, referred to as framework metrics. The metrics provided by the Constellation framework are:
Basic Satellite Metrics#
Metric |
Description |
Value Type |
Interval |
|---|---|---|---|
|
Current run identifier. Updated whenever it changes. |
String |
- |
|
Current satellite state. Updated when changed. |
String |
- |
|
CPU load average over the past 1 minute, provided in percent. |
Float |
10s |
|
Available memory in Megabytes. |
Integer |
10s |
Data Transmission#
Depending on the satellite functionality, such as sending or receiving data, a different set of metrics is made available:
Metric |
Description |
Value Type |
Interval |
|---|---|---|---|
|
Amount of bytes transmitted during current run |
Integer |
5s |
|
Number of data blocks transmitted during current run |
Integer |
5s |
|
Number of data records transmitted during current run |
Integer |
5s |
Metric |
Description |
Value Type |
Interval |
|---|---|---|---|
|
Amount of bytes received from all transmitters during current run |
Integer |
5s |
|
Amount of mebibytes available on the file system the current output file is located |
Integer |
5s |
|
Path of the currently used output file for this satellite. Updated whenever it changes. |
String |
- |
A complete list of metrics for each satellite, including both framework and individually defined metrics, can be found in the Satellite Library.
Receiving Telemetry#
Different tools are provided within the Constellation framework for receiving and visualizing metric data, either directly in graphical user interfaces, or by forwarding the data to external services for storage in display.
Real-Time Dashboard#
The TelemetryConsole listener is a flexible real-time dashboard for telemetry data based on Qt. A a listener, it is a pure user interface and does not provide any storage facilities for metrics. Its main window is shown in Figure 35 and structured in two parts.
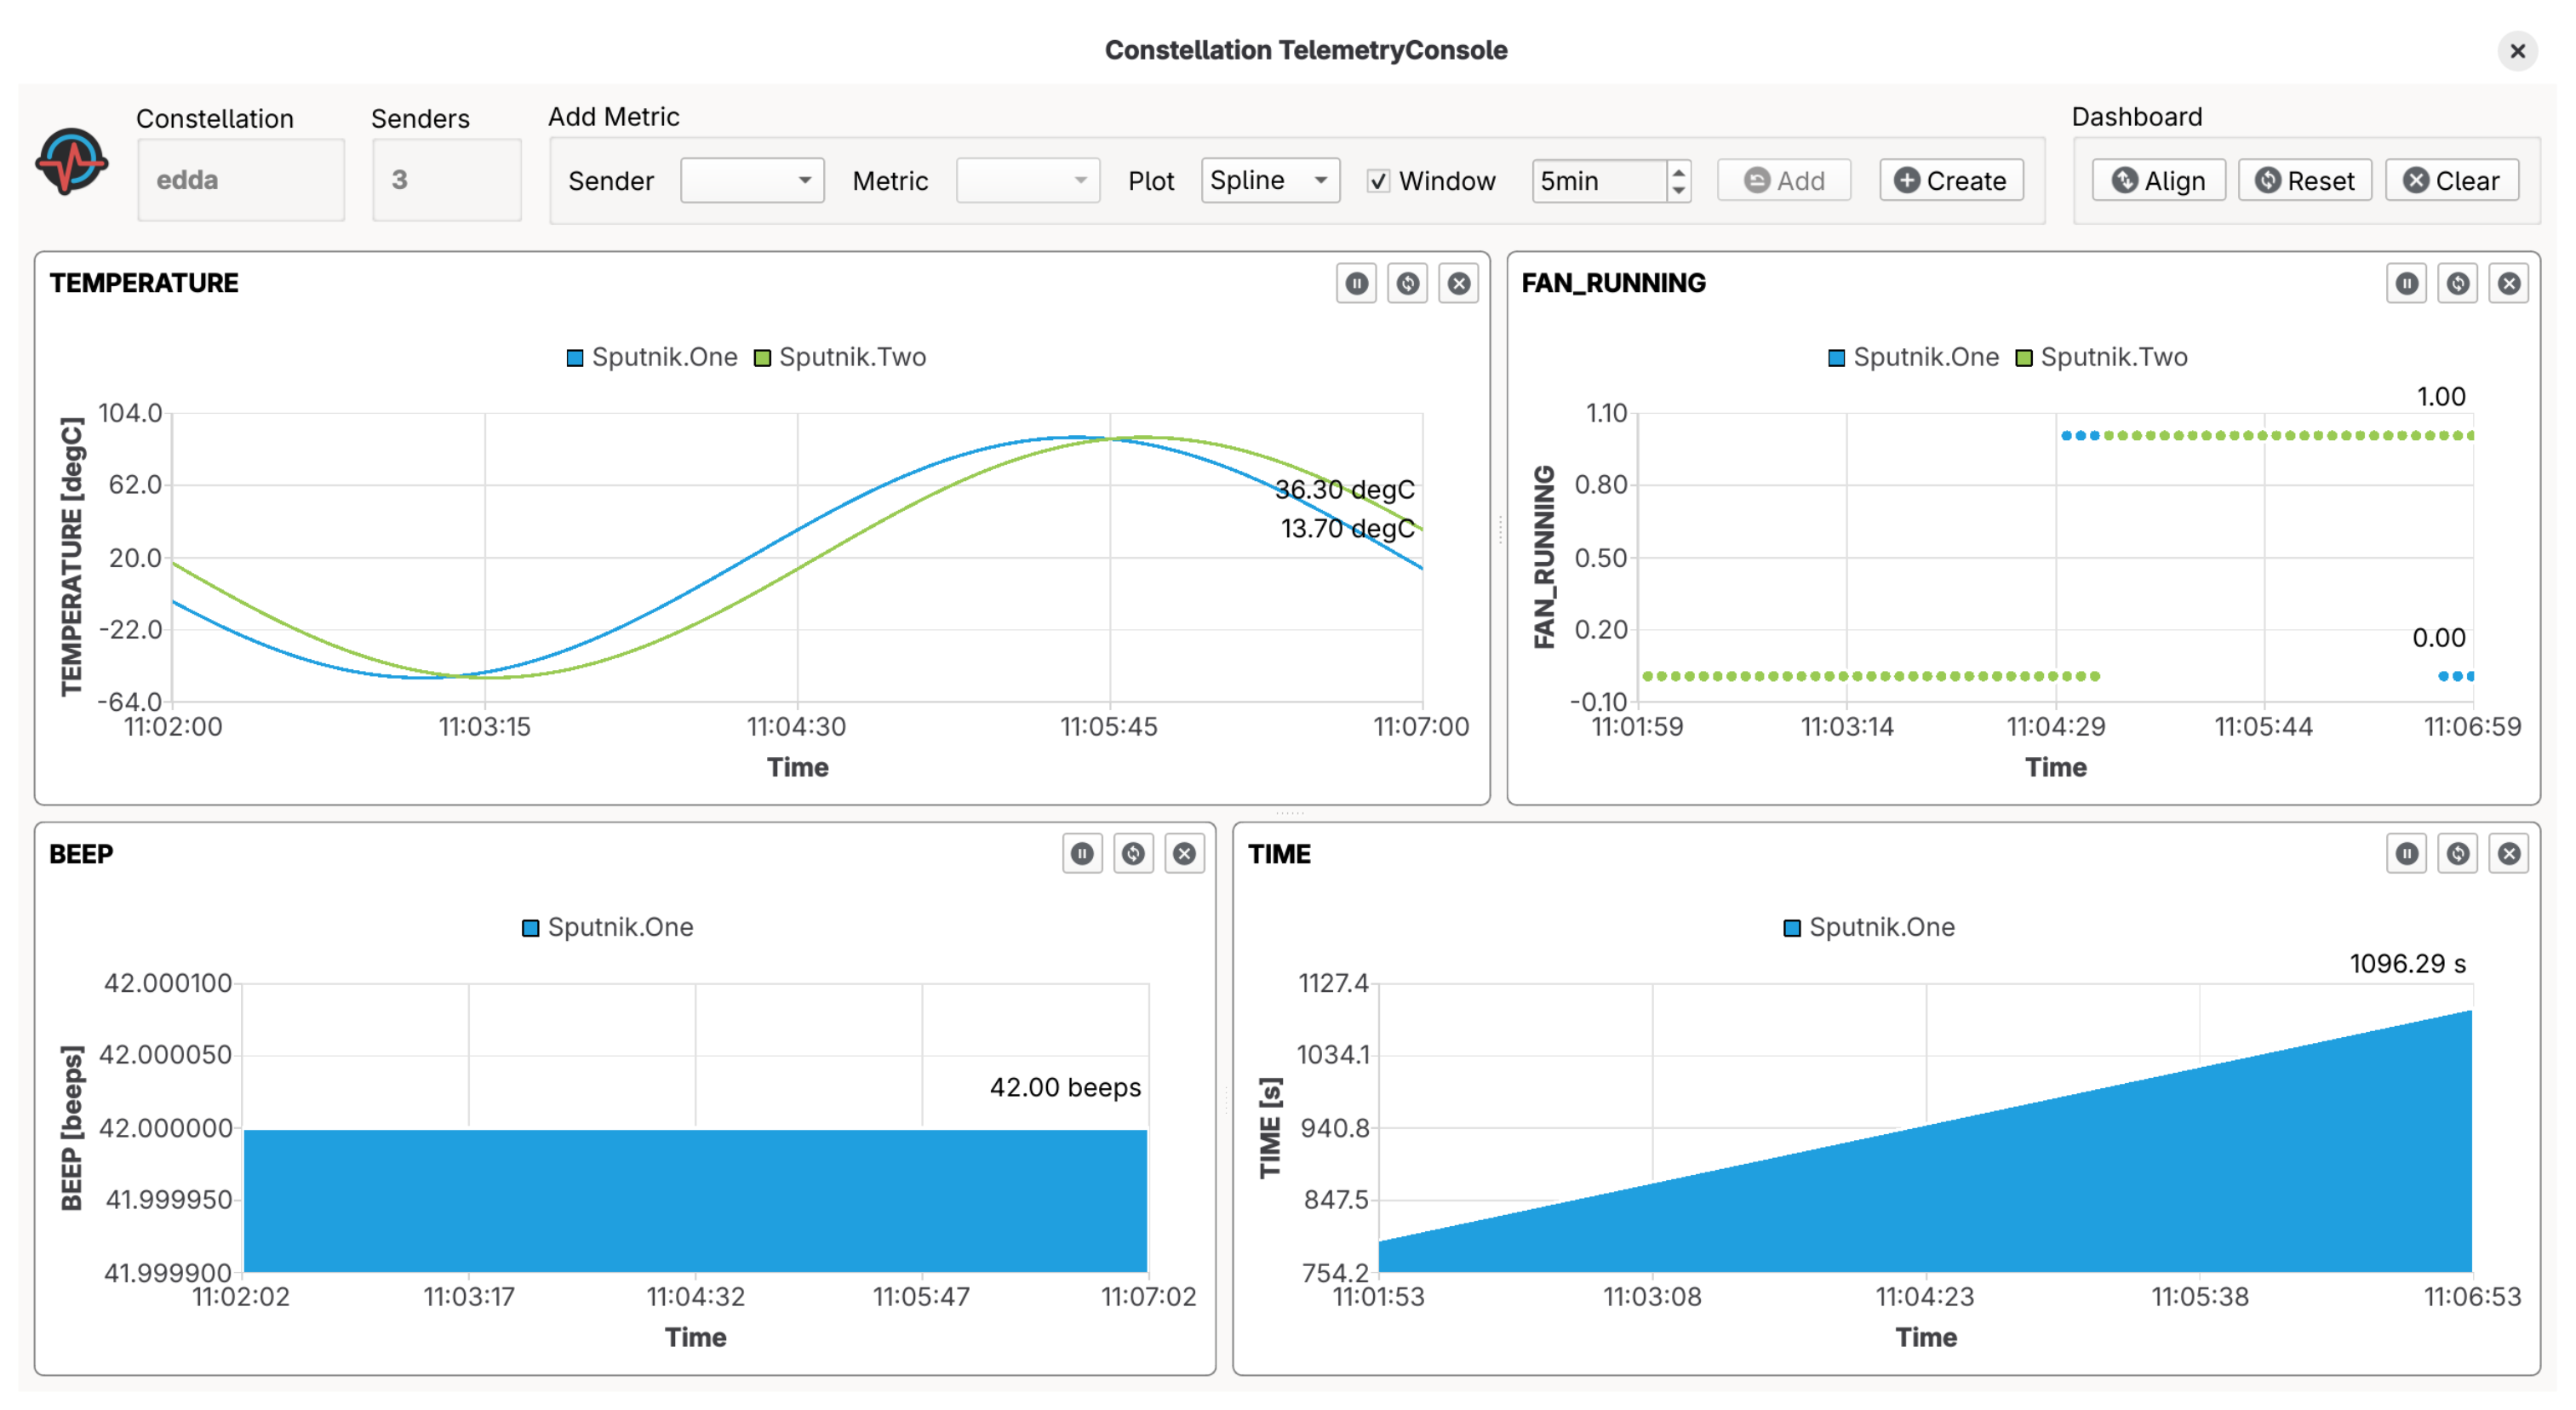
Figure 35 Main window of the TelemetryConsole real-time metric dashboard#
The central area is the dashboard displaying the selected metrics. Charts are updated in real-time as new metric messages are received from the Constellation. The individual sections of the grid can be freely resized and charts can be added, reset or removed at any time. When closing the application, the current dashboard configuration is saved and can be recalled upon reopening. Charts with currently unconnected satellites are displayed with a red background, an orange background indicates that the respective satellite is connected but does not currently advertise this metric.
The header bar located at the top of the window contains the facilities to add new charts to the dashboard. It provides drop-down boxes to select the sender and the metric name, as well as different plotting styles. Metrics to which a chart already exists in the dashboard can be added to the same chart using the Add button, while the Create button generates a new chart and adds it to the dashboard. On the right side of the header bar, three buttons allow to realign all charts, reset all data or clear the entire dashboard.
See also
The Using TelemetryConsole tutorial demonstrates the TelemetryConsole dashboard.
Grafana Dashboards#
Persistent telemetry data storage and visualization can be achieved e.g. with the Influx satellite, which writes metrics to an InfluxDB time-series database. This database can serve as data source for Grafana or compatible tools.
See also
The Setting up InfluxDB and Grafana how-to guide covers setting up and configuring persistent metric storage and visualization.