
Using Observatory#
Observatory is a graphical listener for Constellation. This tutorial demonstrates how to use Observatory to receive log message from multiple satellites and how to filter for specific log messages.
See also
It is recommend to read through the tutorial on how to use MissionControl first.
Starting Observatory#
Observatory is started using the Observatory command or by searching for it in the application overview if installed
system-wide. On startup, the group name of the Constellation which should be controlled needs to be provided as
demonstrated in Figure 10.
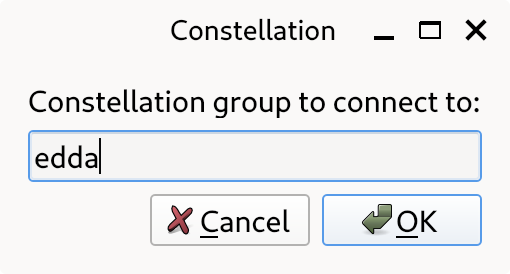
Figure 10 Observatory startup window#
Hint
Alternatively, Observatory can be started with a group directly using the -g GROUP command line argument.
The main window of Observatory, shown in Figure 11, can be divided into three parts:
A filter section on top to search through and filter already received messages in the interface
A subscription section on the right to select which log messages to receive
A list of all log messages
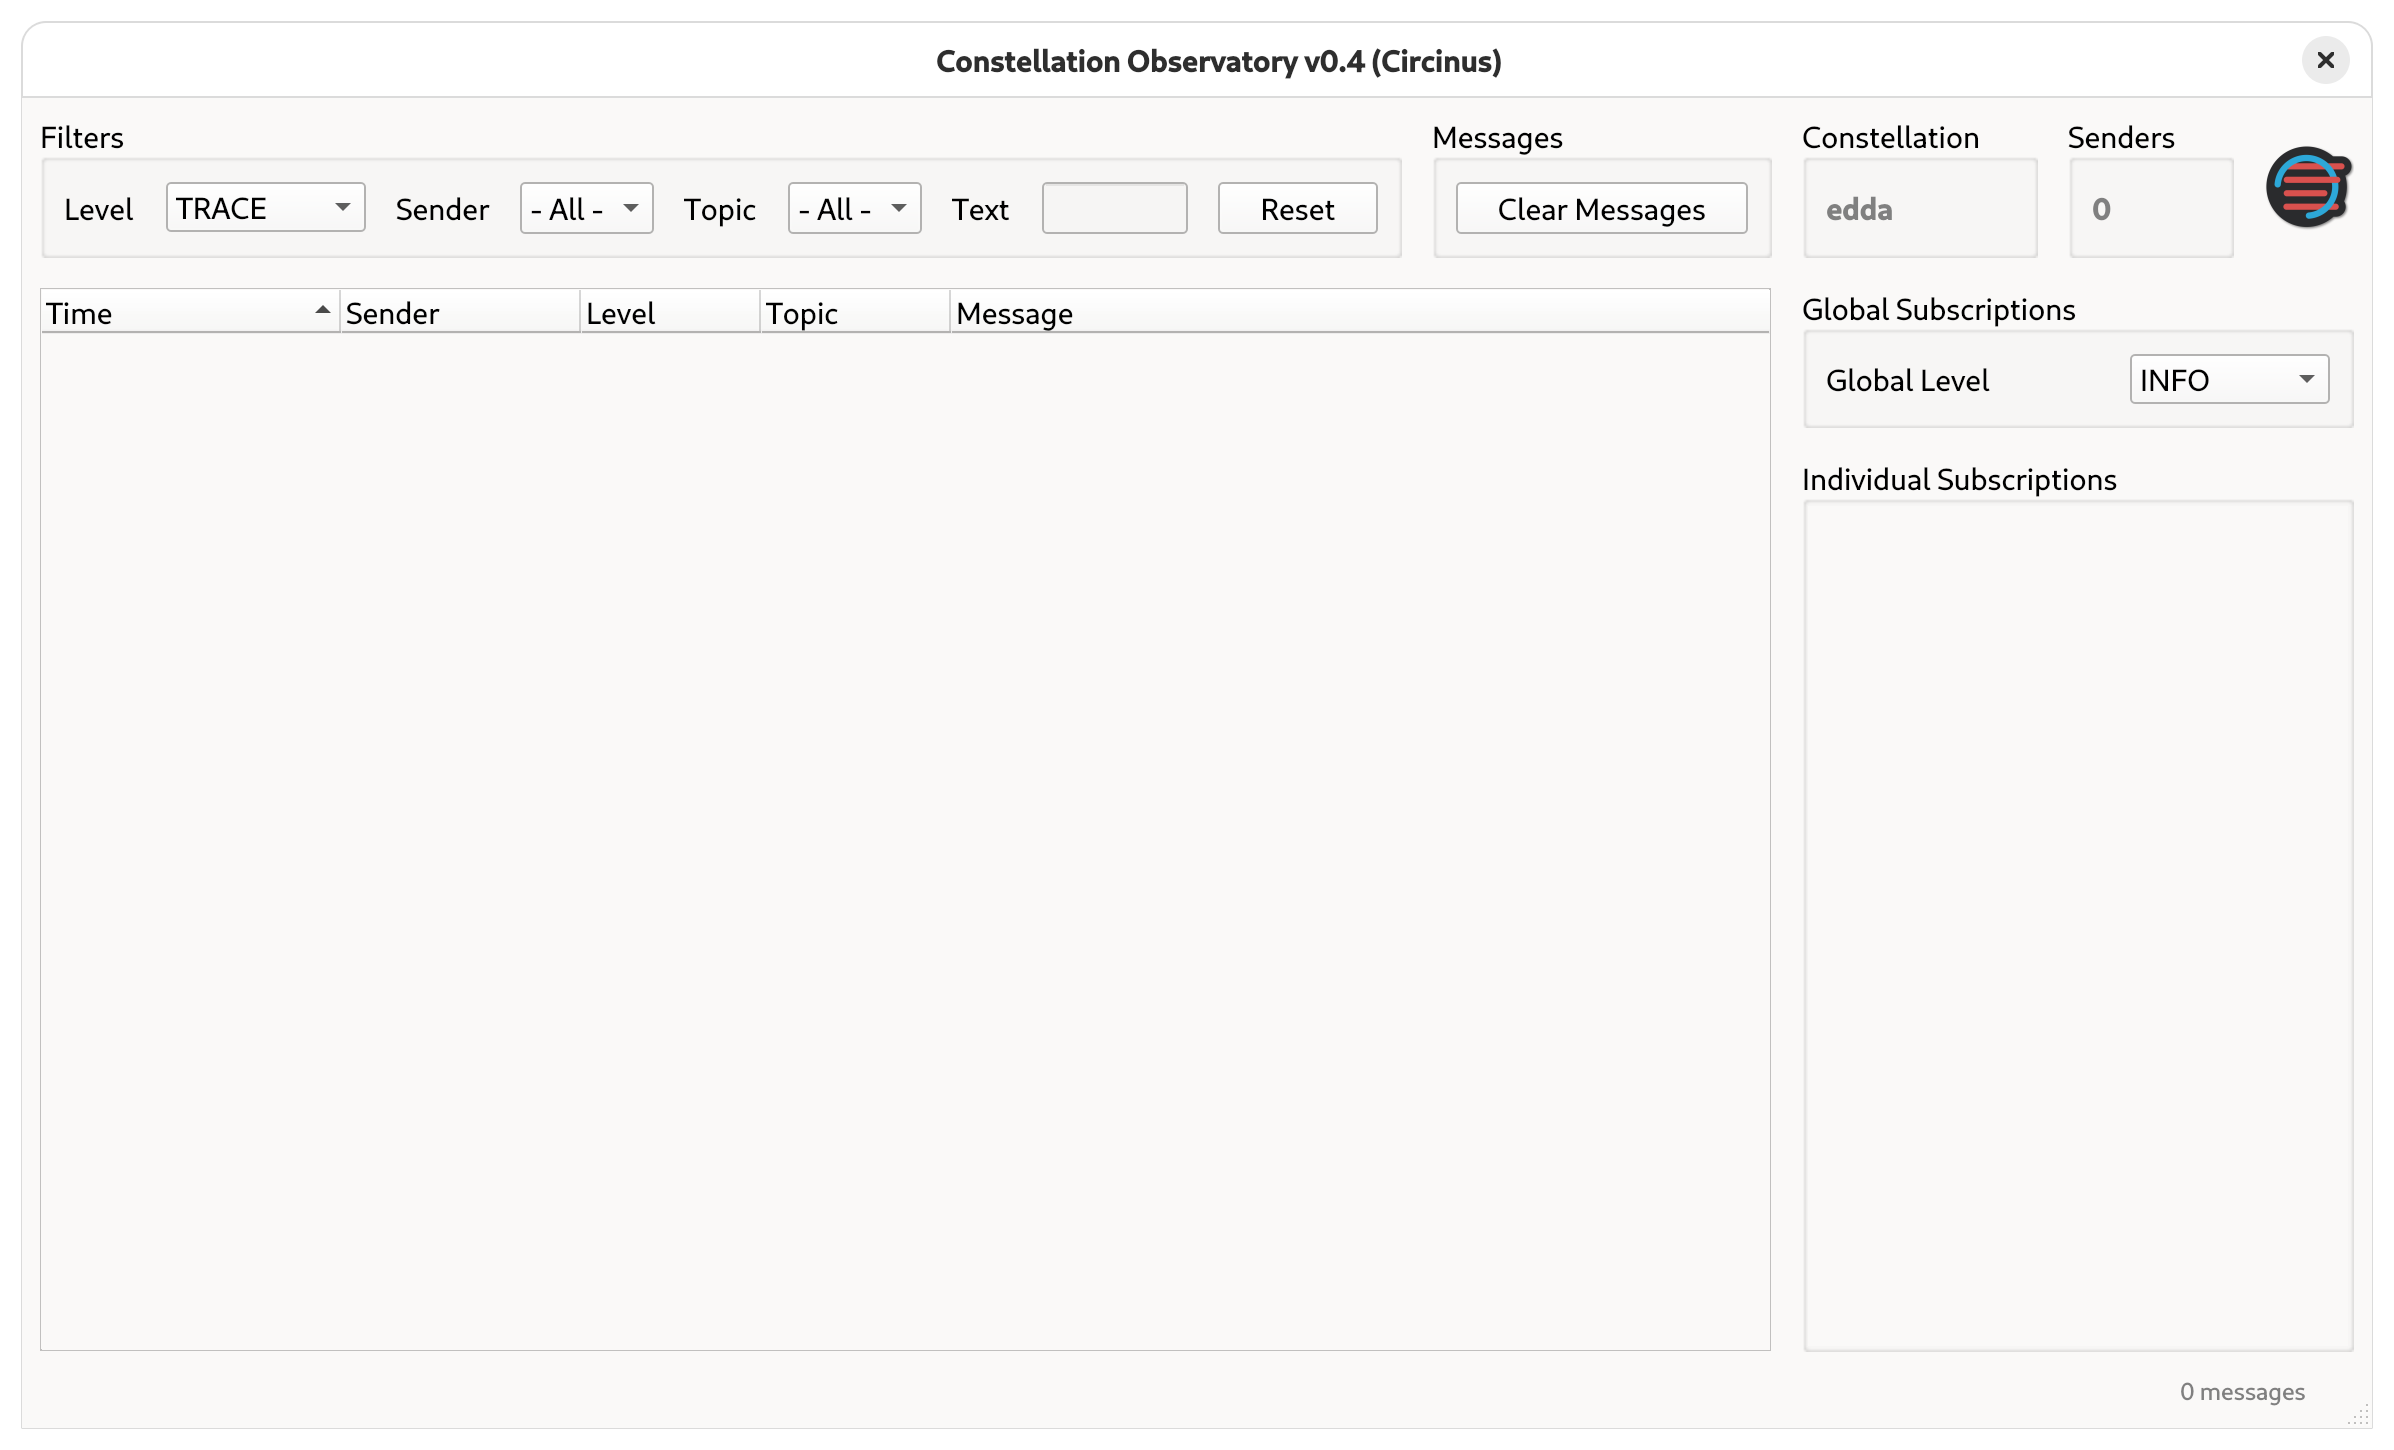
Figure 11 Observatory main window without log messages#
Initializing the Constellation#
In order to control satellites, some satellites need to be started as part of the same group. In this tutorial,
two Sputnik satellites named One and Two, a RandomTransmitter named Sender and a EudaqNativeWriter
named Receiver are started and show up in Observatory as show in Figure 12.
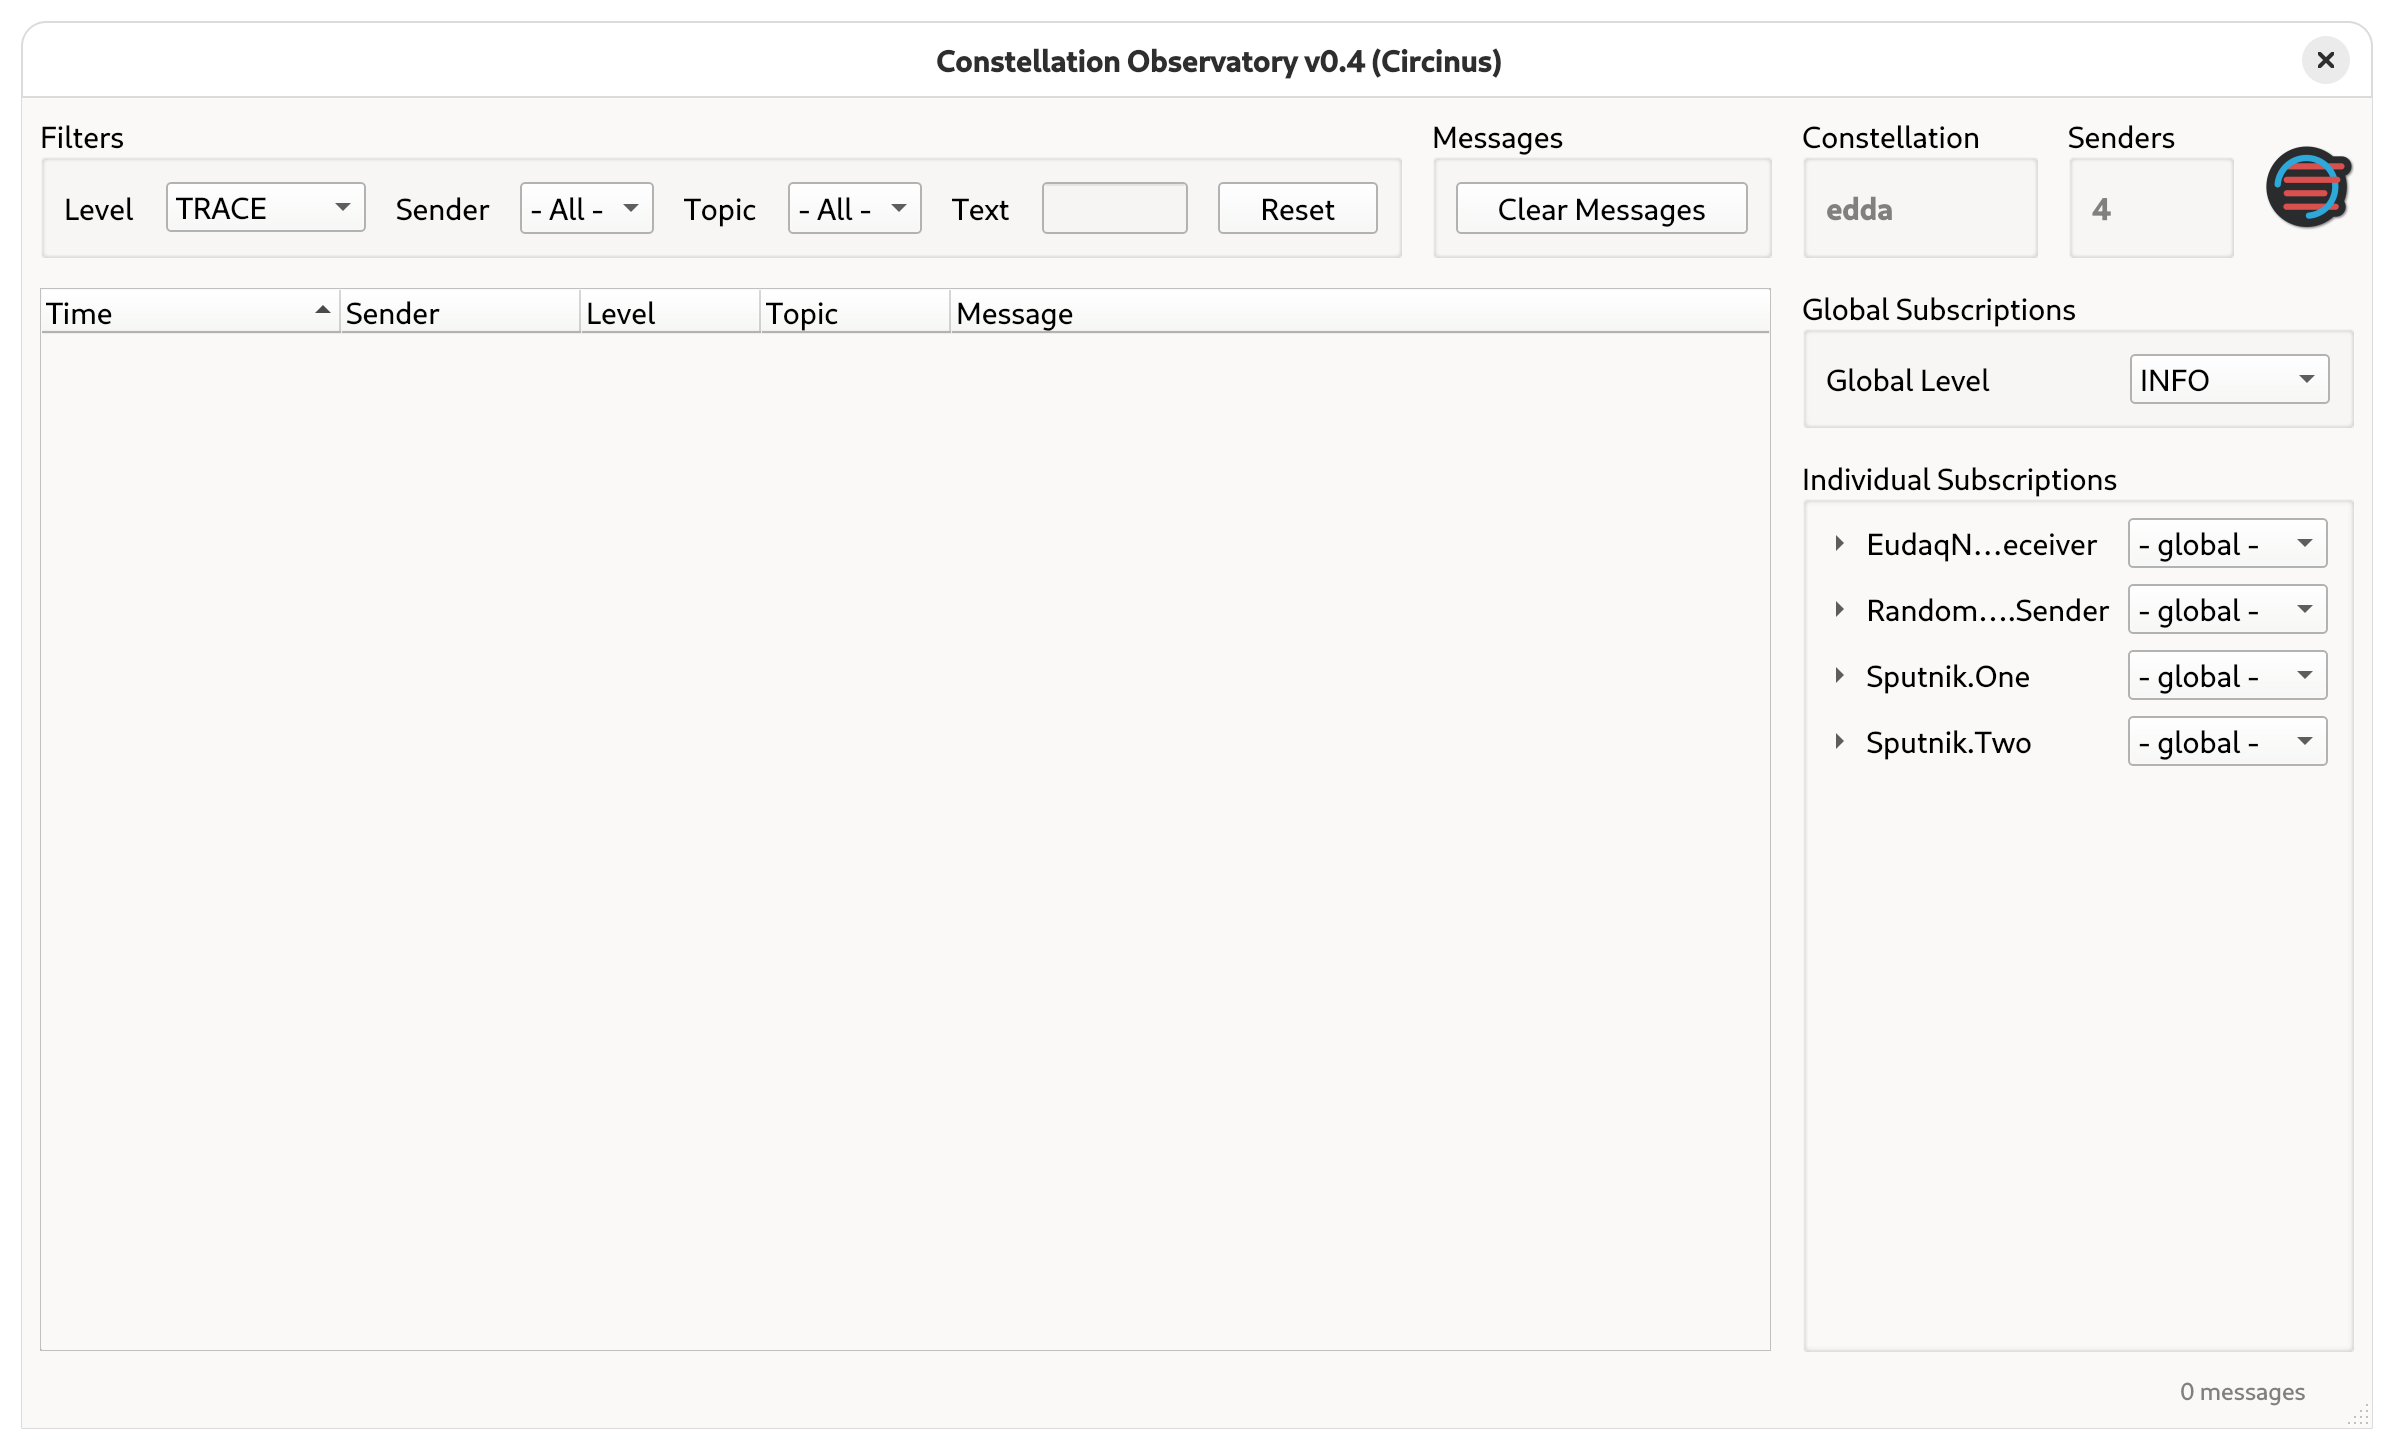
Figure 12 Observatory main window after satellites are started#
To initialize the satellites, MissionControl can be used with the following configuration file:
[Sputnik.One]
unused_parameter = 1

[Sputnik.Two]

[RandomTransmitter.Sender]

[EudaqNativeWriter.Receiver]
_data.receive_from = ["Sender"]
output_directory = "/tmp/test"
Important
Make sure to create the output directory for the EudaqNativeWriter.
After the (failed) initialization, various log messages are displayed as demonstrated in Figure 13. Log messages with
log level STATUS are shown in green, log messages with log level WARNING in orange and log message with log level
CRITICAL in red. Additionally, in the bottom right corner of the window a message counter is shown.
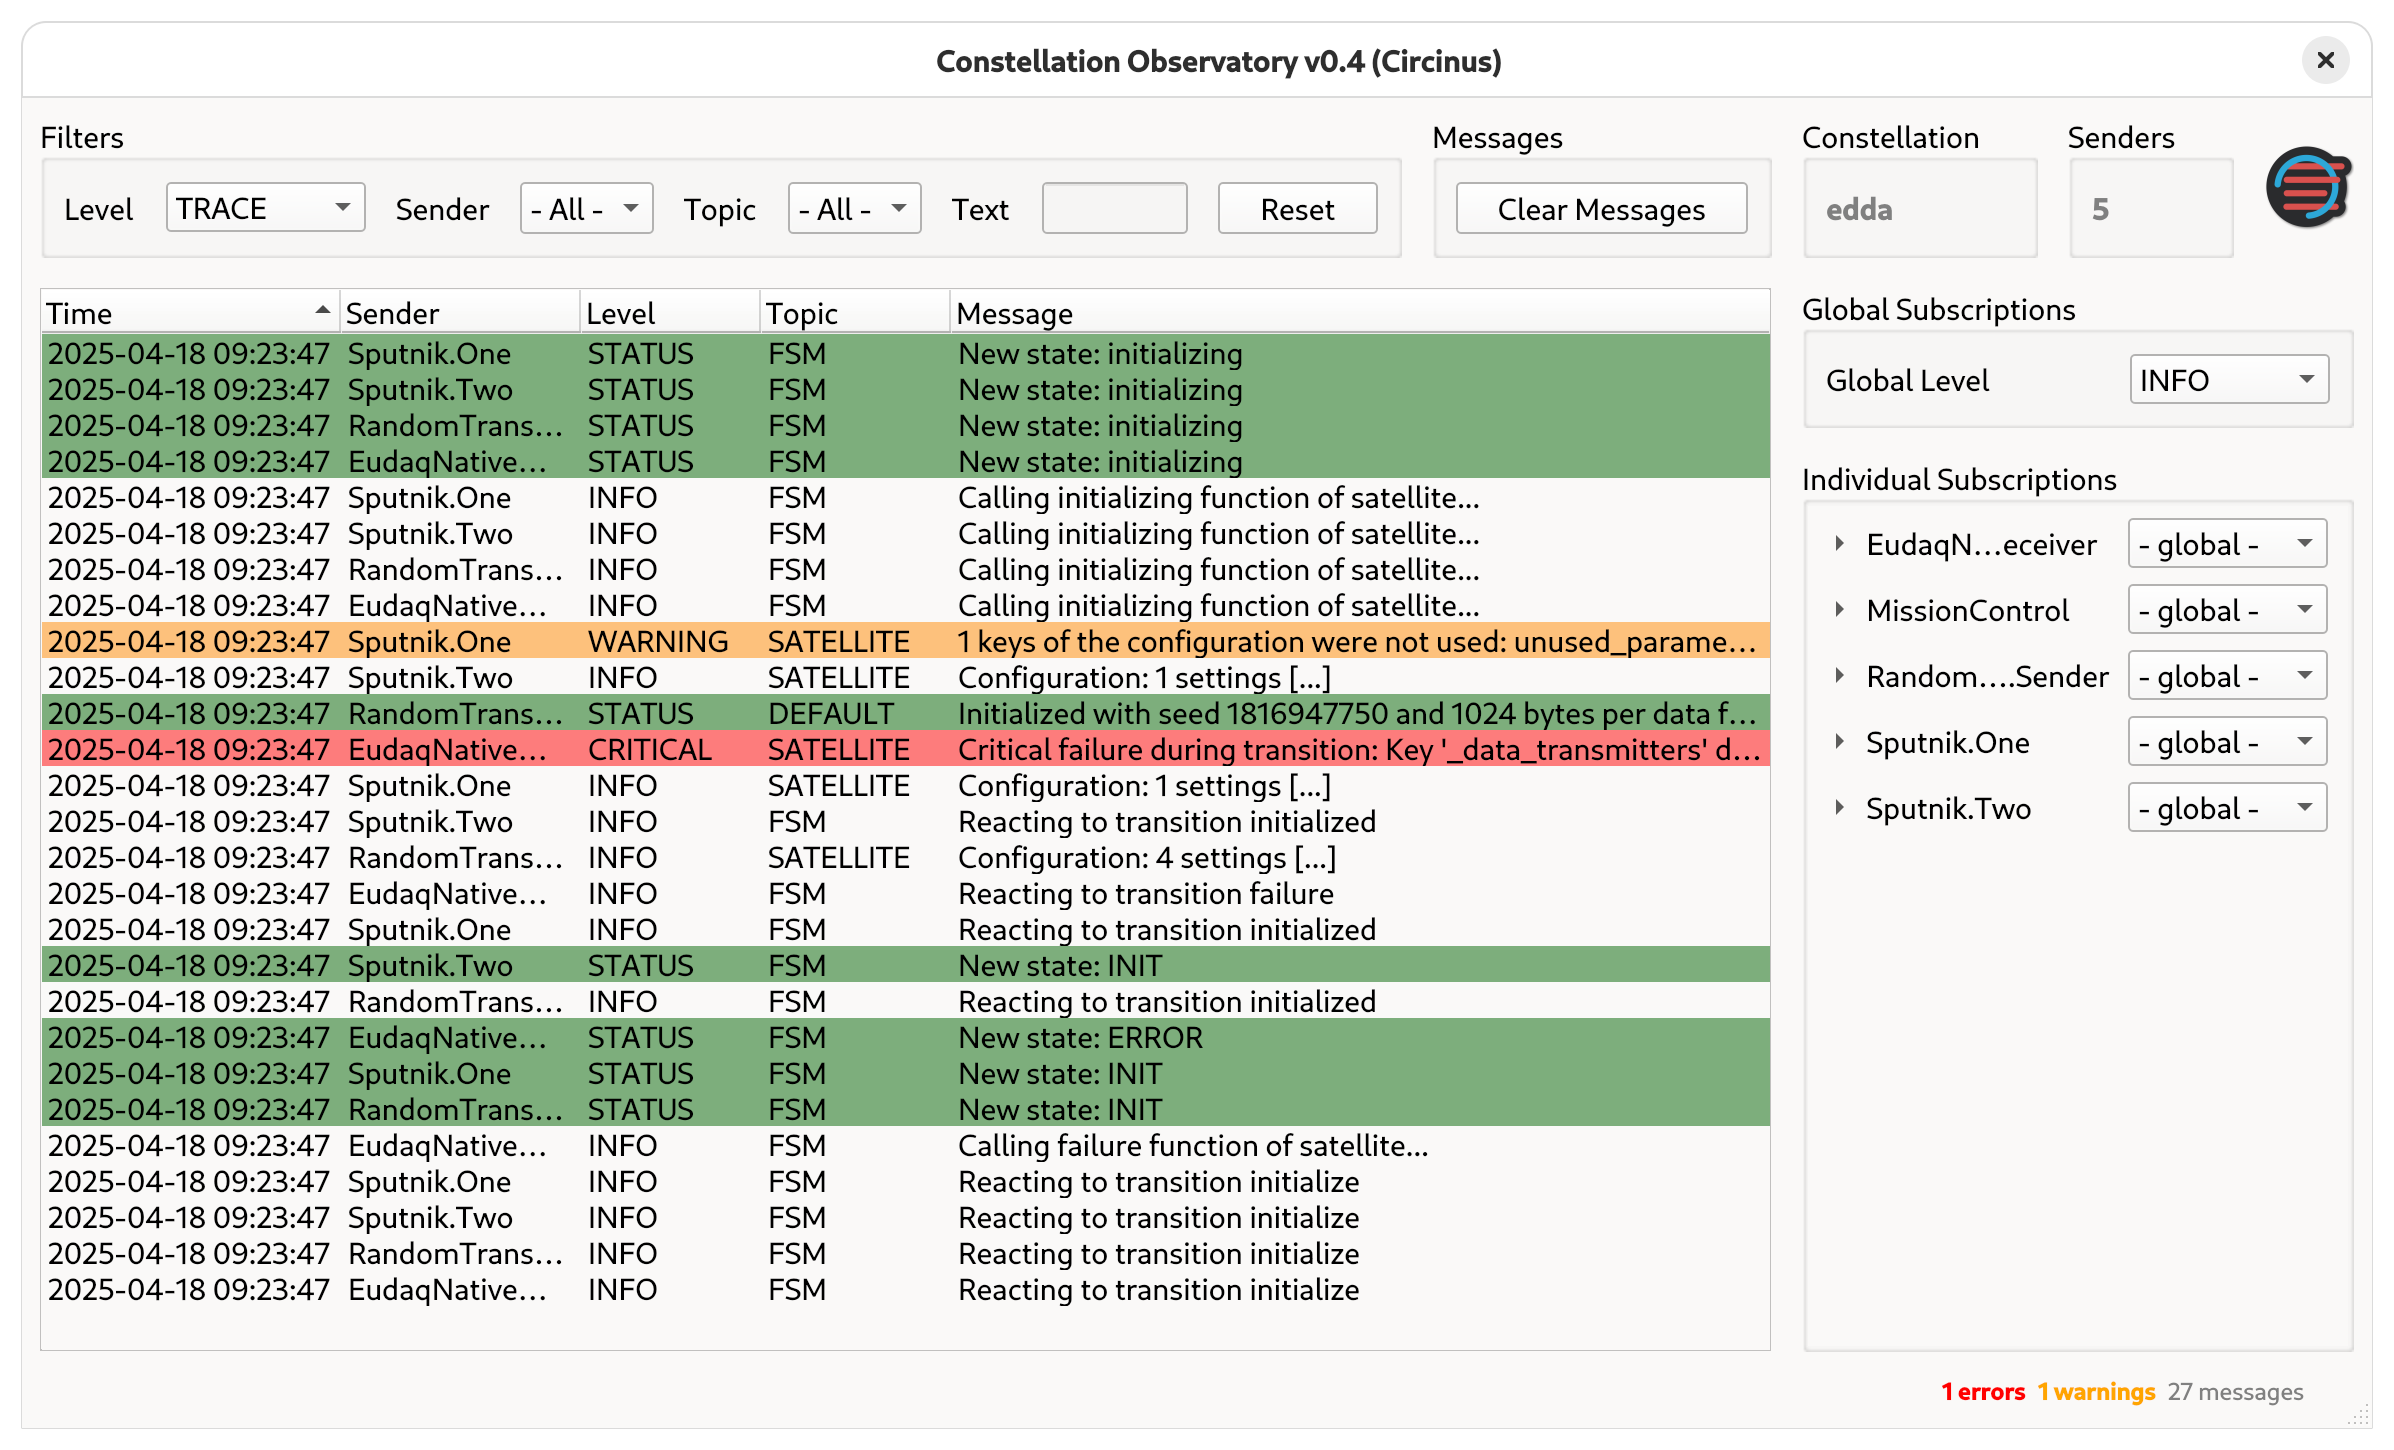
Figure 13 Observatory main window after initialization#
To further inspect a log messages, it is possible to double-click on them to open the details dialog about the log message show in Figure 14.
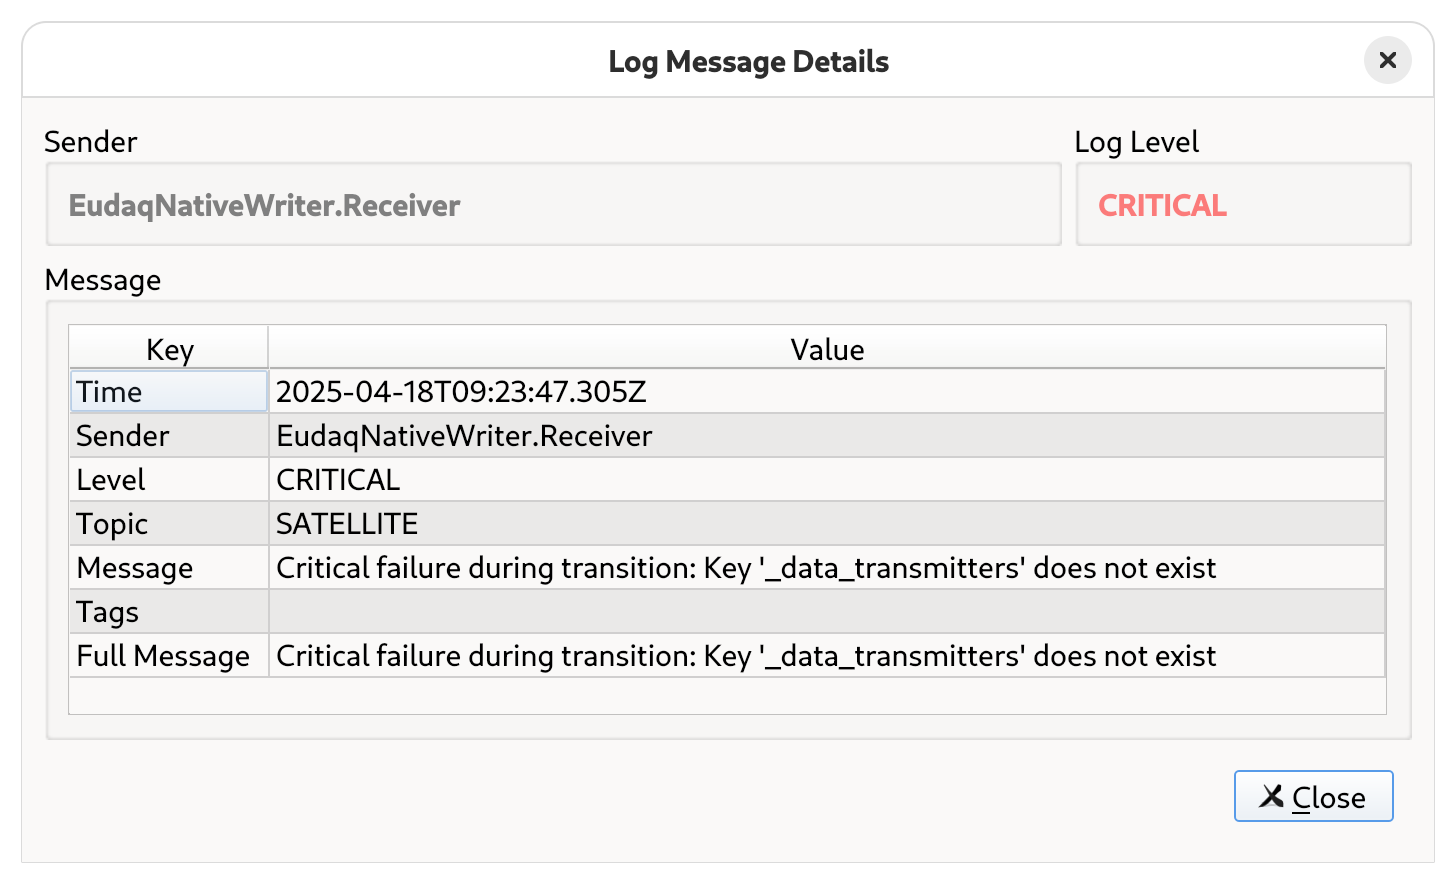
Figure 14 Log message details#
To fix this issue, the configuration file has to be adjusted:
[Sputnik.One]

[Sputnik.Two]

[RandomTransmitter.Sender]

[EudaqNativeWriter.Receiver]
_data.receive_from = ["RandomTransmitter.Sender"]
output_directory = "/tmp/test"
Received messages can be cleared with the Clear Messages button. This helps to review the logs after initializing with the adjusted configuration.
Changing the Subscription Level#
Constellation groups log messages in different severity levels, ranging from “very low-level information” (TRACE) to
“system-critical failure messages” (CRITICAL). More detailed information can be found in the
logging & verbosity chapter
The level of log messages to be received by this logger can be adjusted with the Global Level selection box
in the subscription section on the right.
After adjusting the subscription, new log messages of selected level and all higher levels are received when generated e.g.
by launching the satellites.
For debugging purposes, it can be useful to increase the log level beyond the default log level as demonstrated in Figure 15.
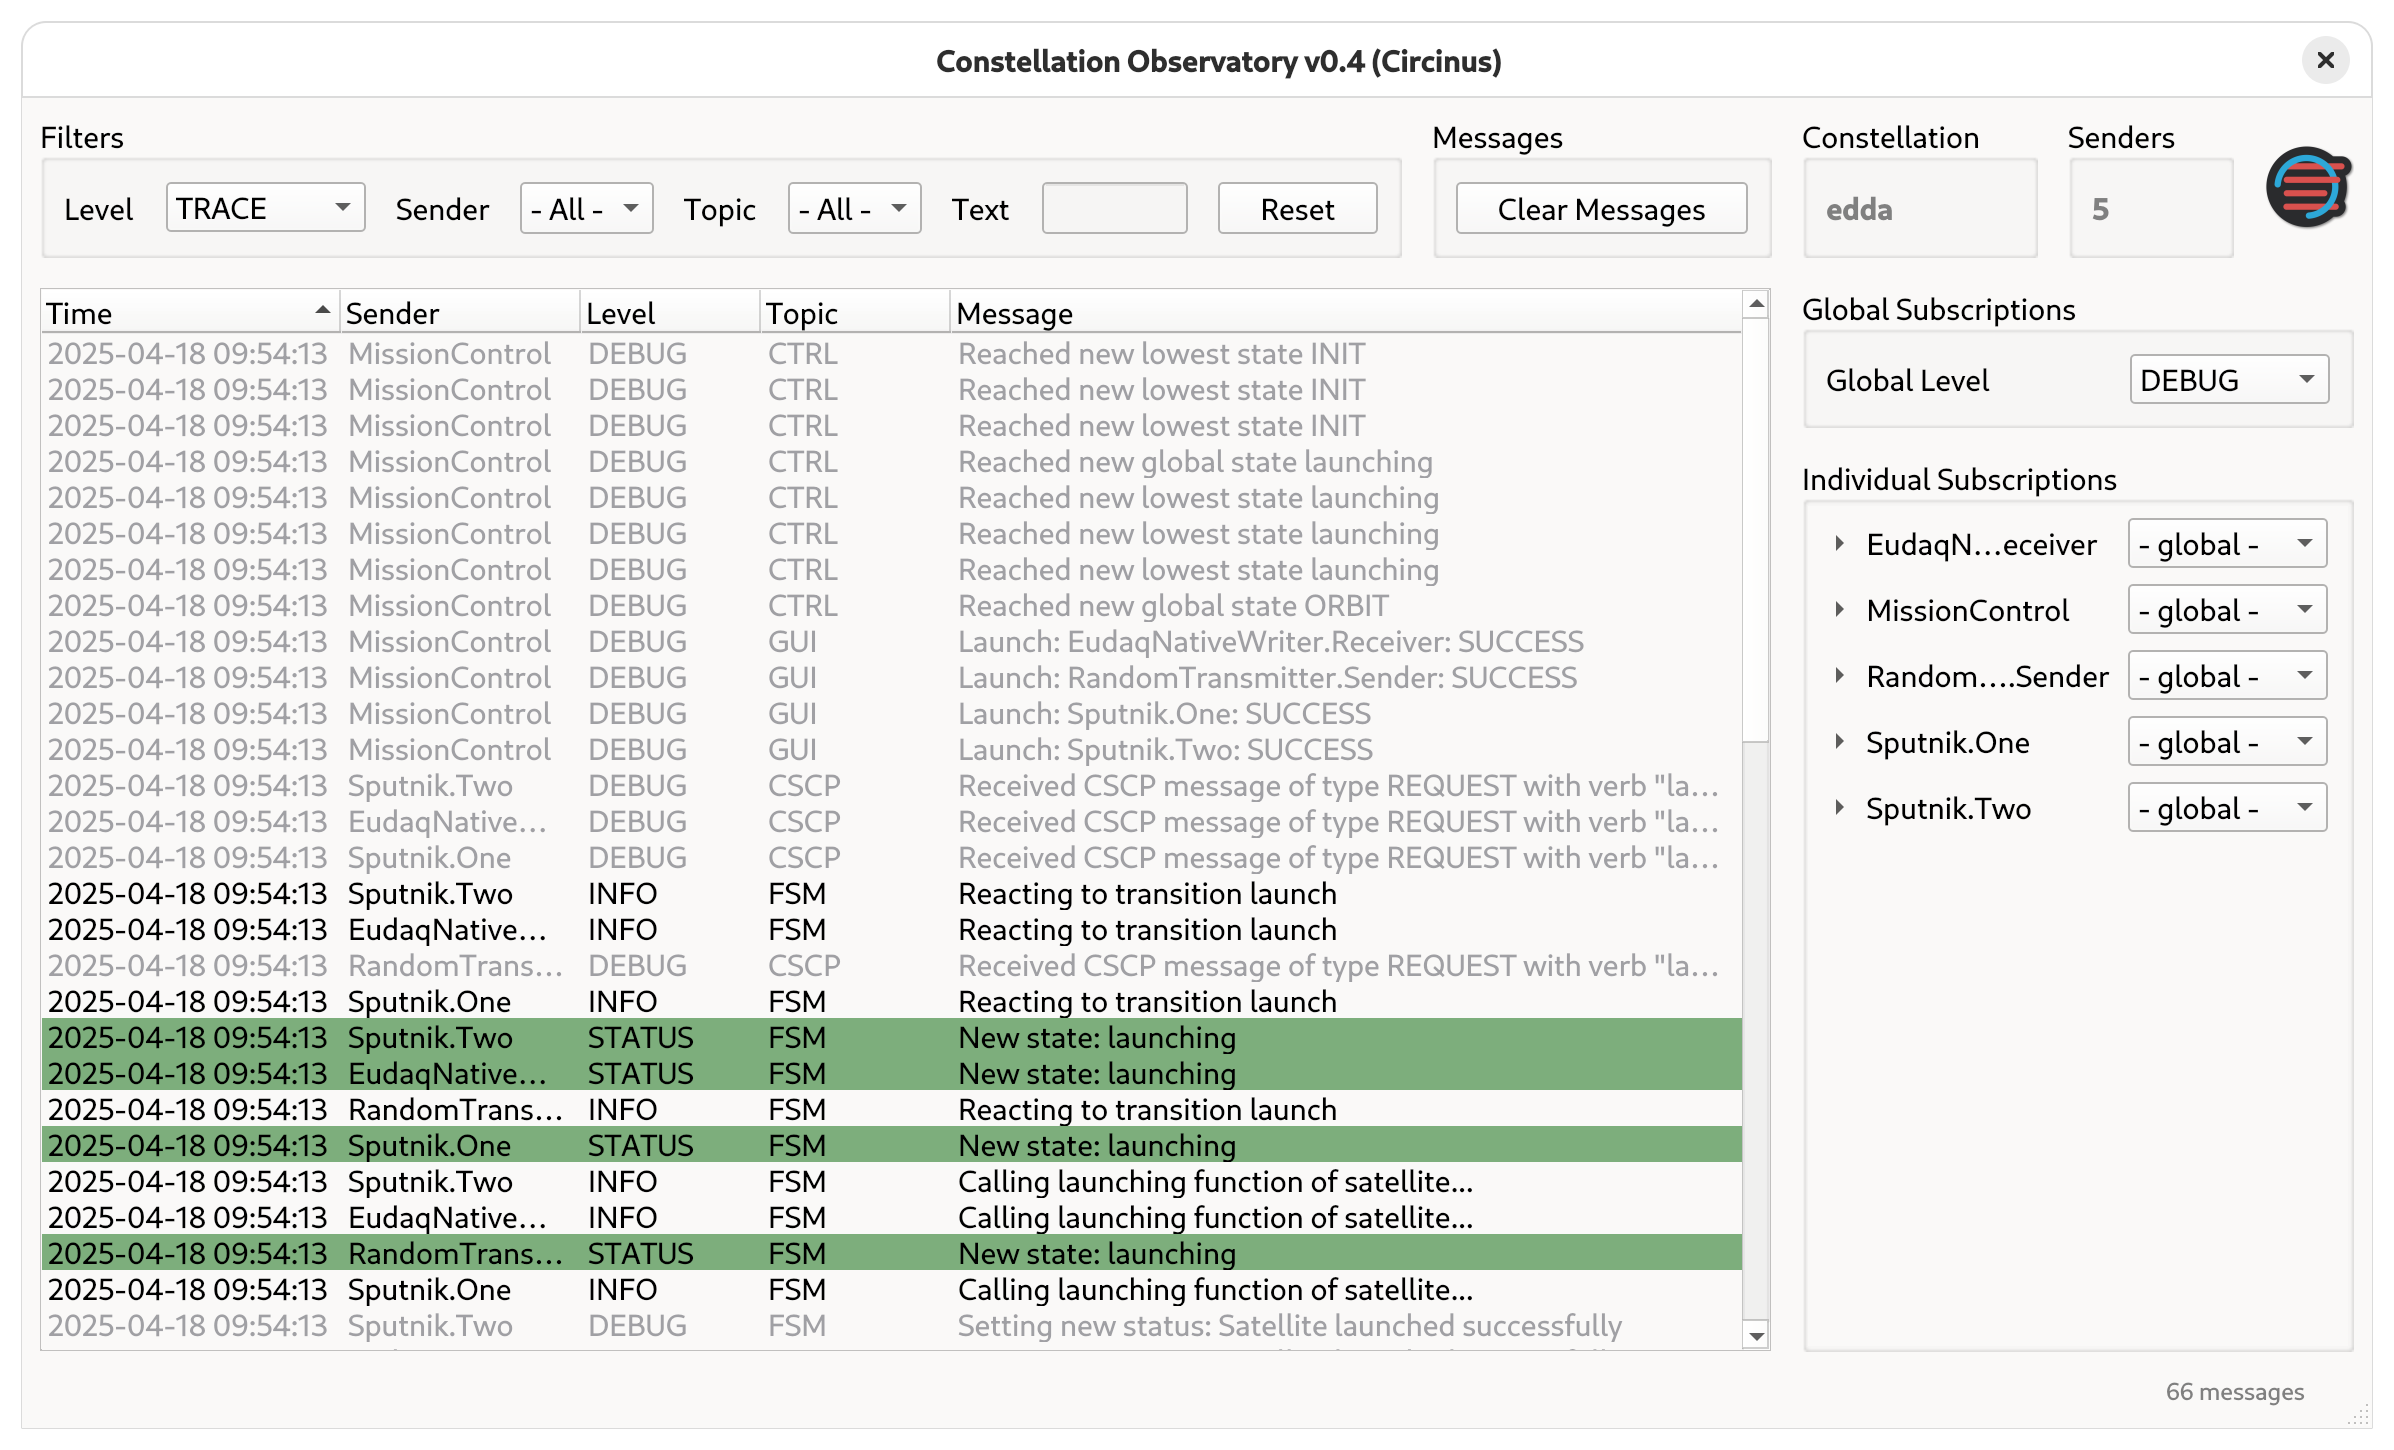
Figure 15 Observatory main window with debug messages#
Important
Only log messages with log level DEBUG emitted after changing the subscription are visible. It is not possible to view
debug messages before that moment since they have not been sent by the satellites.
The log level selection offered directly next to the sender name allows to change the subscription level for the type topic
of that sender, for Sputnik.One this would be SPUTNIK. This is usually the log topic under which instrument code will log
information.
It is also possible to increase the verbosity for a specific log topic of a sender. For example, to see heart-beating in
action it is possible to increase the verbosity of the LINK topic to TRACE for the Sputnik.One sender.
This is achieved by clicking on the name of the sender in the subscription window on the right and the adjusting the log level for the topic as done in Figure 16. A list of common log topics is provided in the logging section.
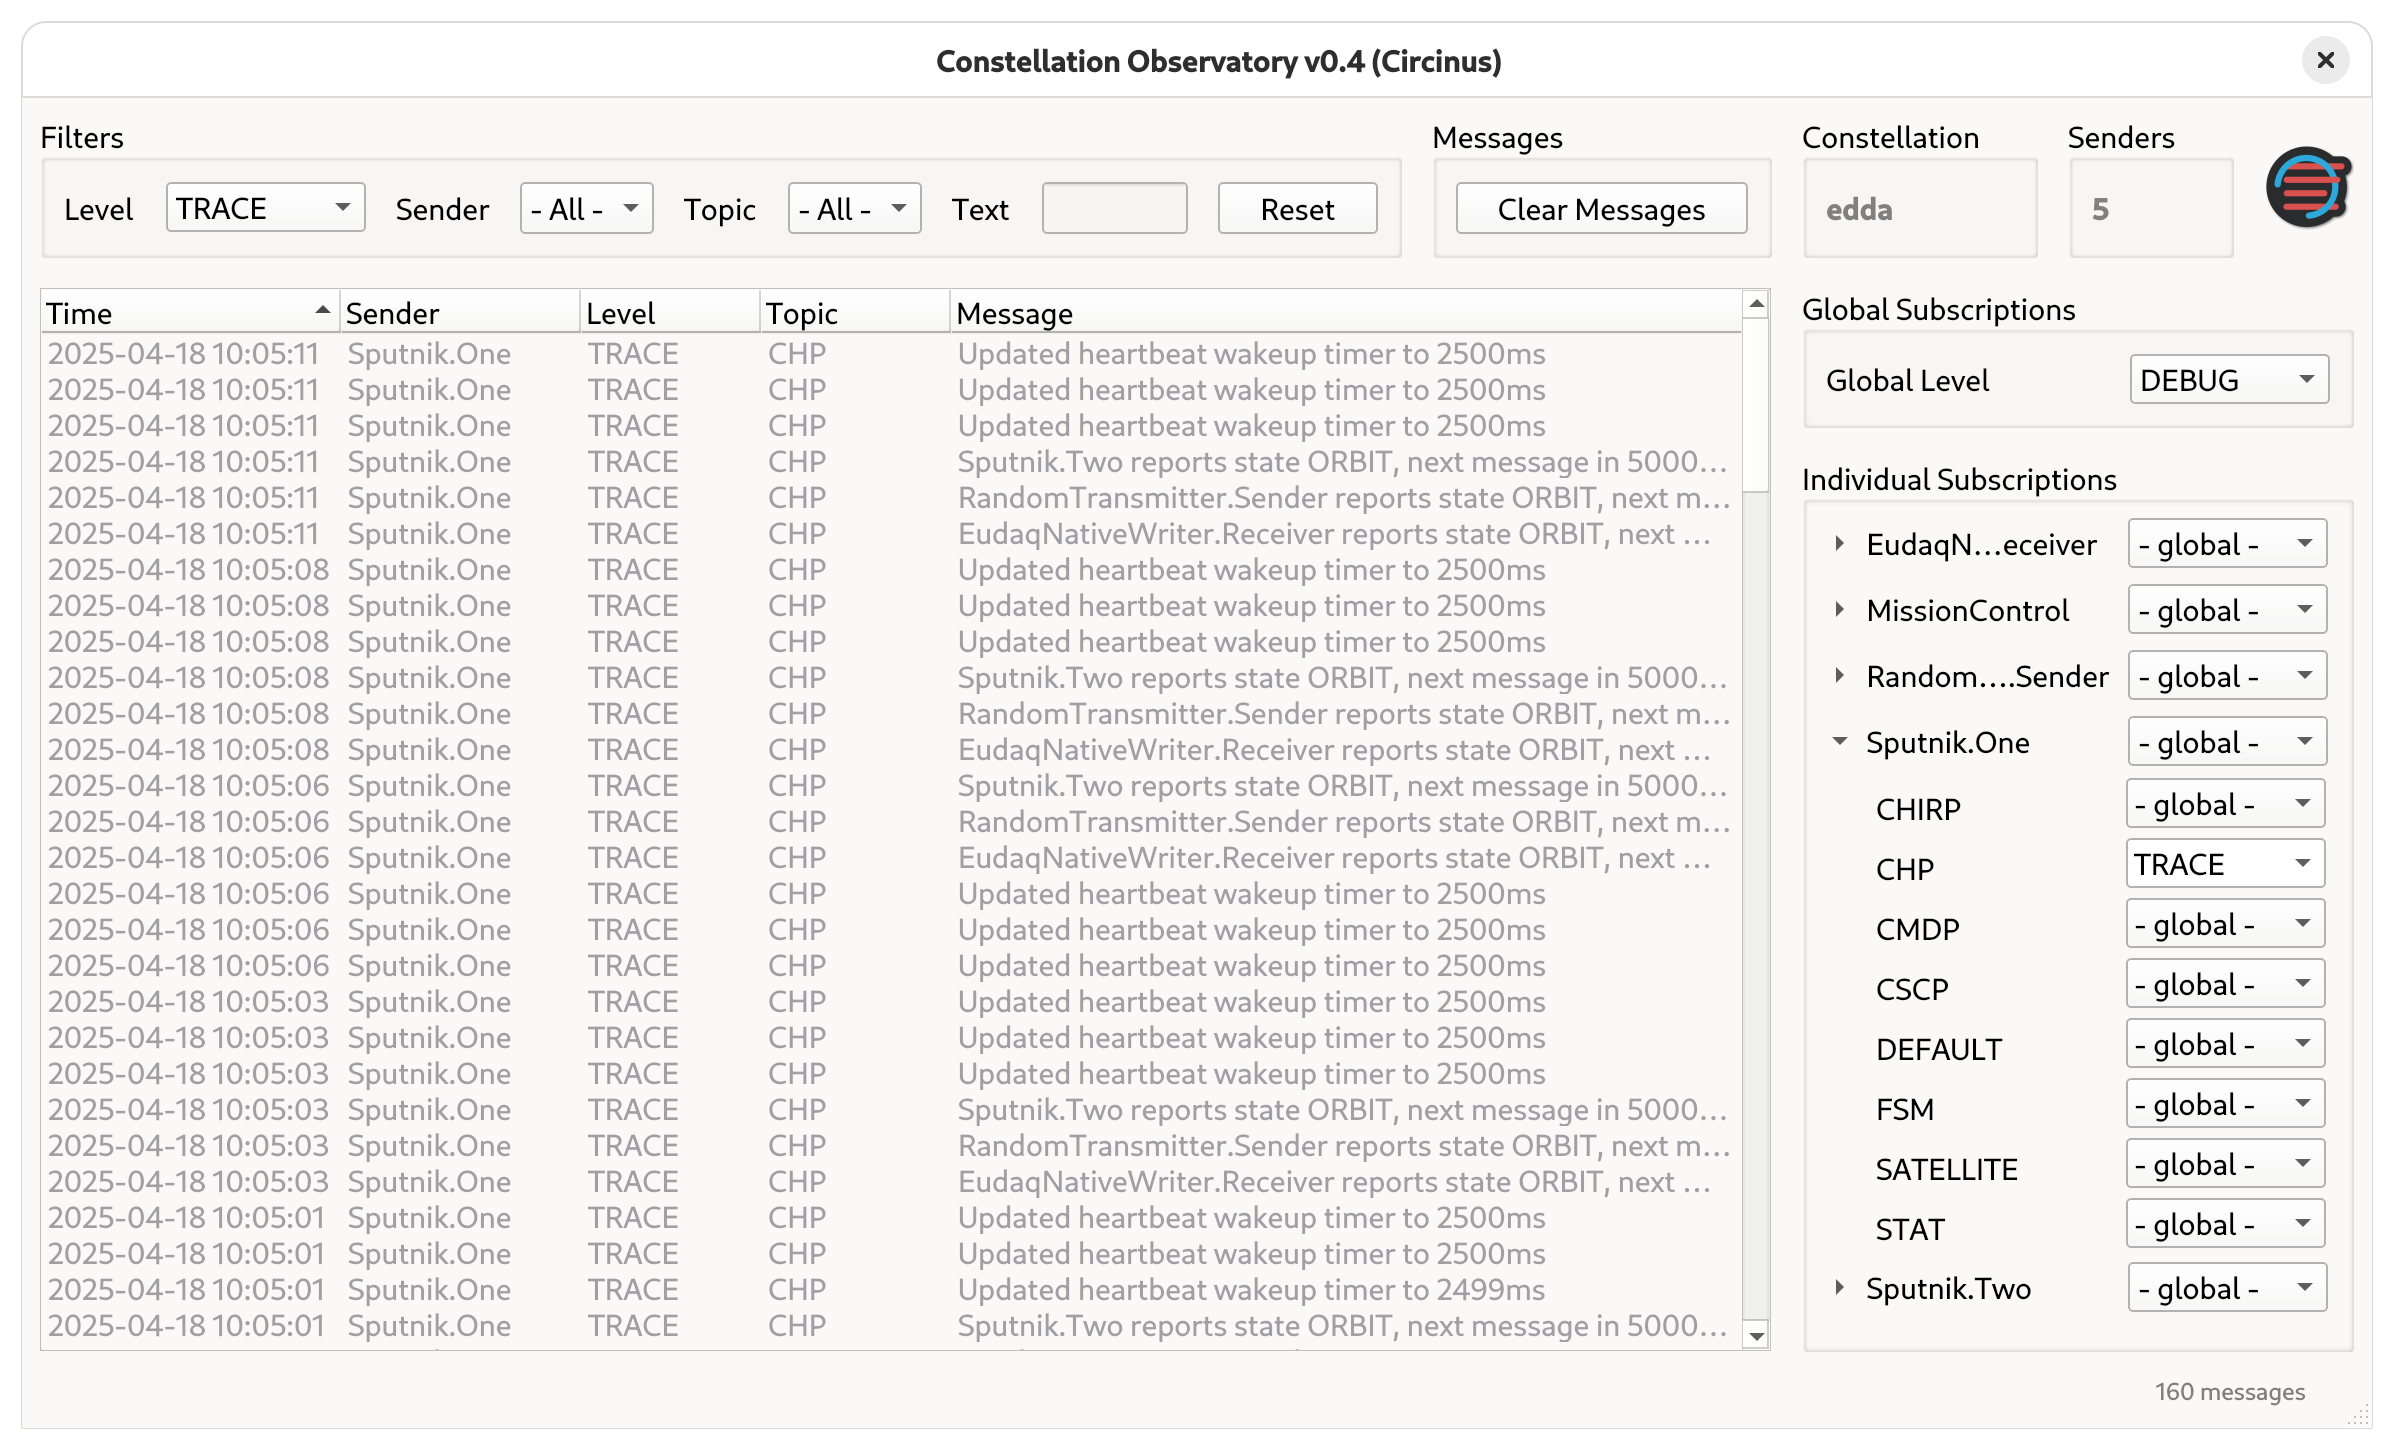
Figure 16 Observatory main window with trace messages for heart-beating#
Important
The individual subscription only provide the possibility to set extra subscriptions. Setting a higher level than the global level does not result in filtering of messages for that specific topic.
Filtering Messages#
Observatory allows applying four filters on the messages that have already been received and are displayed in the log message list of the interface:
Filtering by log level
Filtering by sender
Filtering by log topic
Filtering by text matching log messages
For example, to find the LINK messages referring to RandomTransmitter.Sender, messages can be filtered using text matching
the name of that satellite as demonstrated in as done in Figure 17.
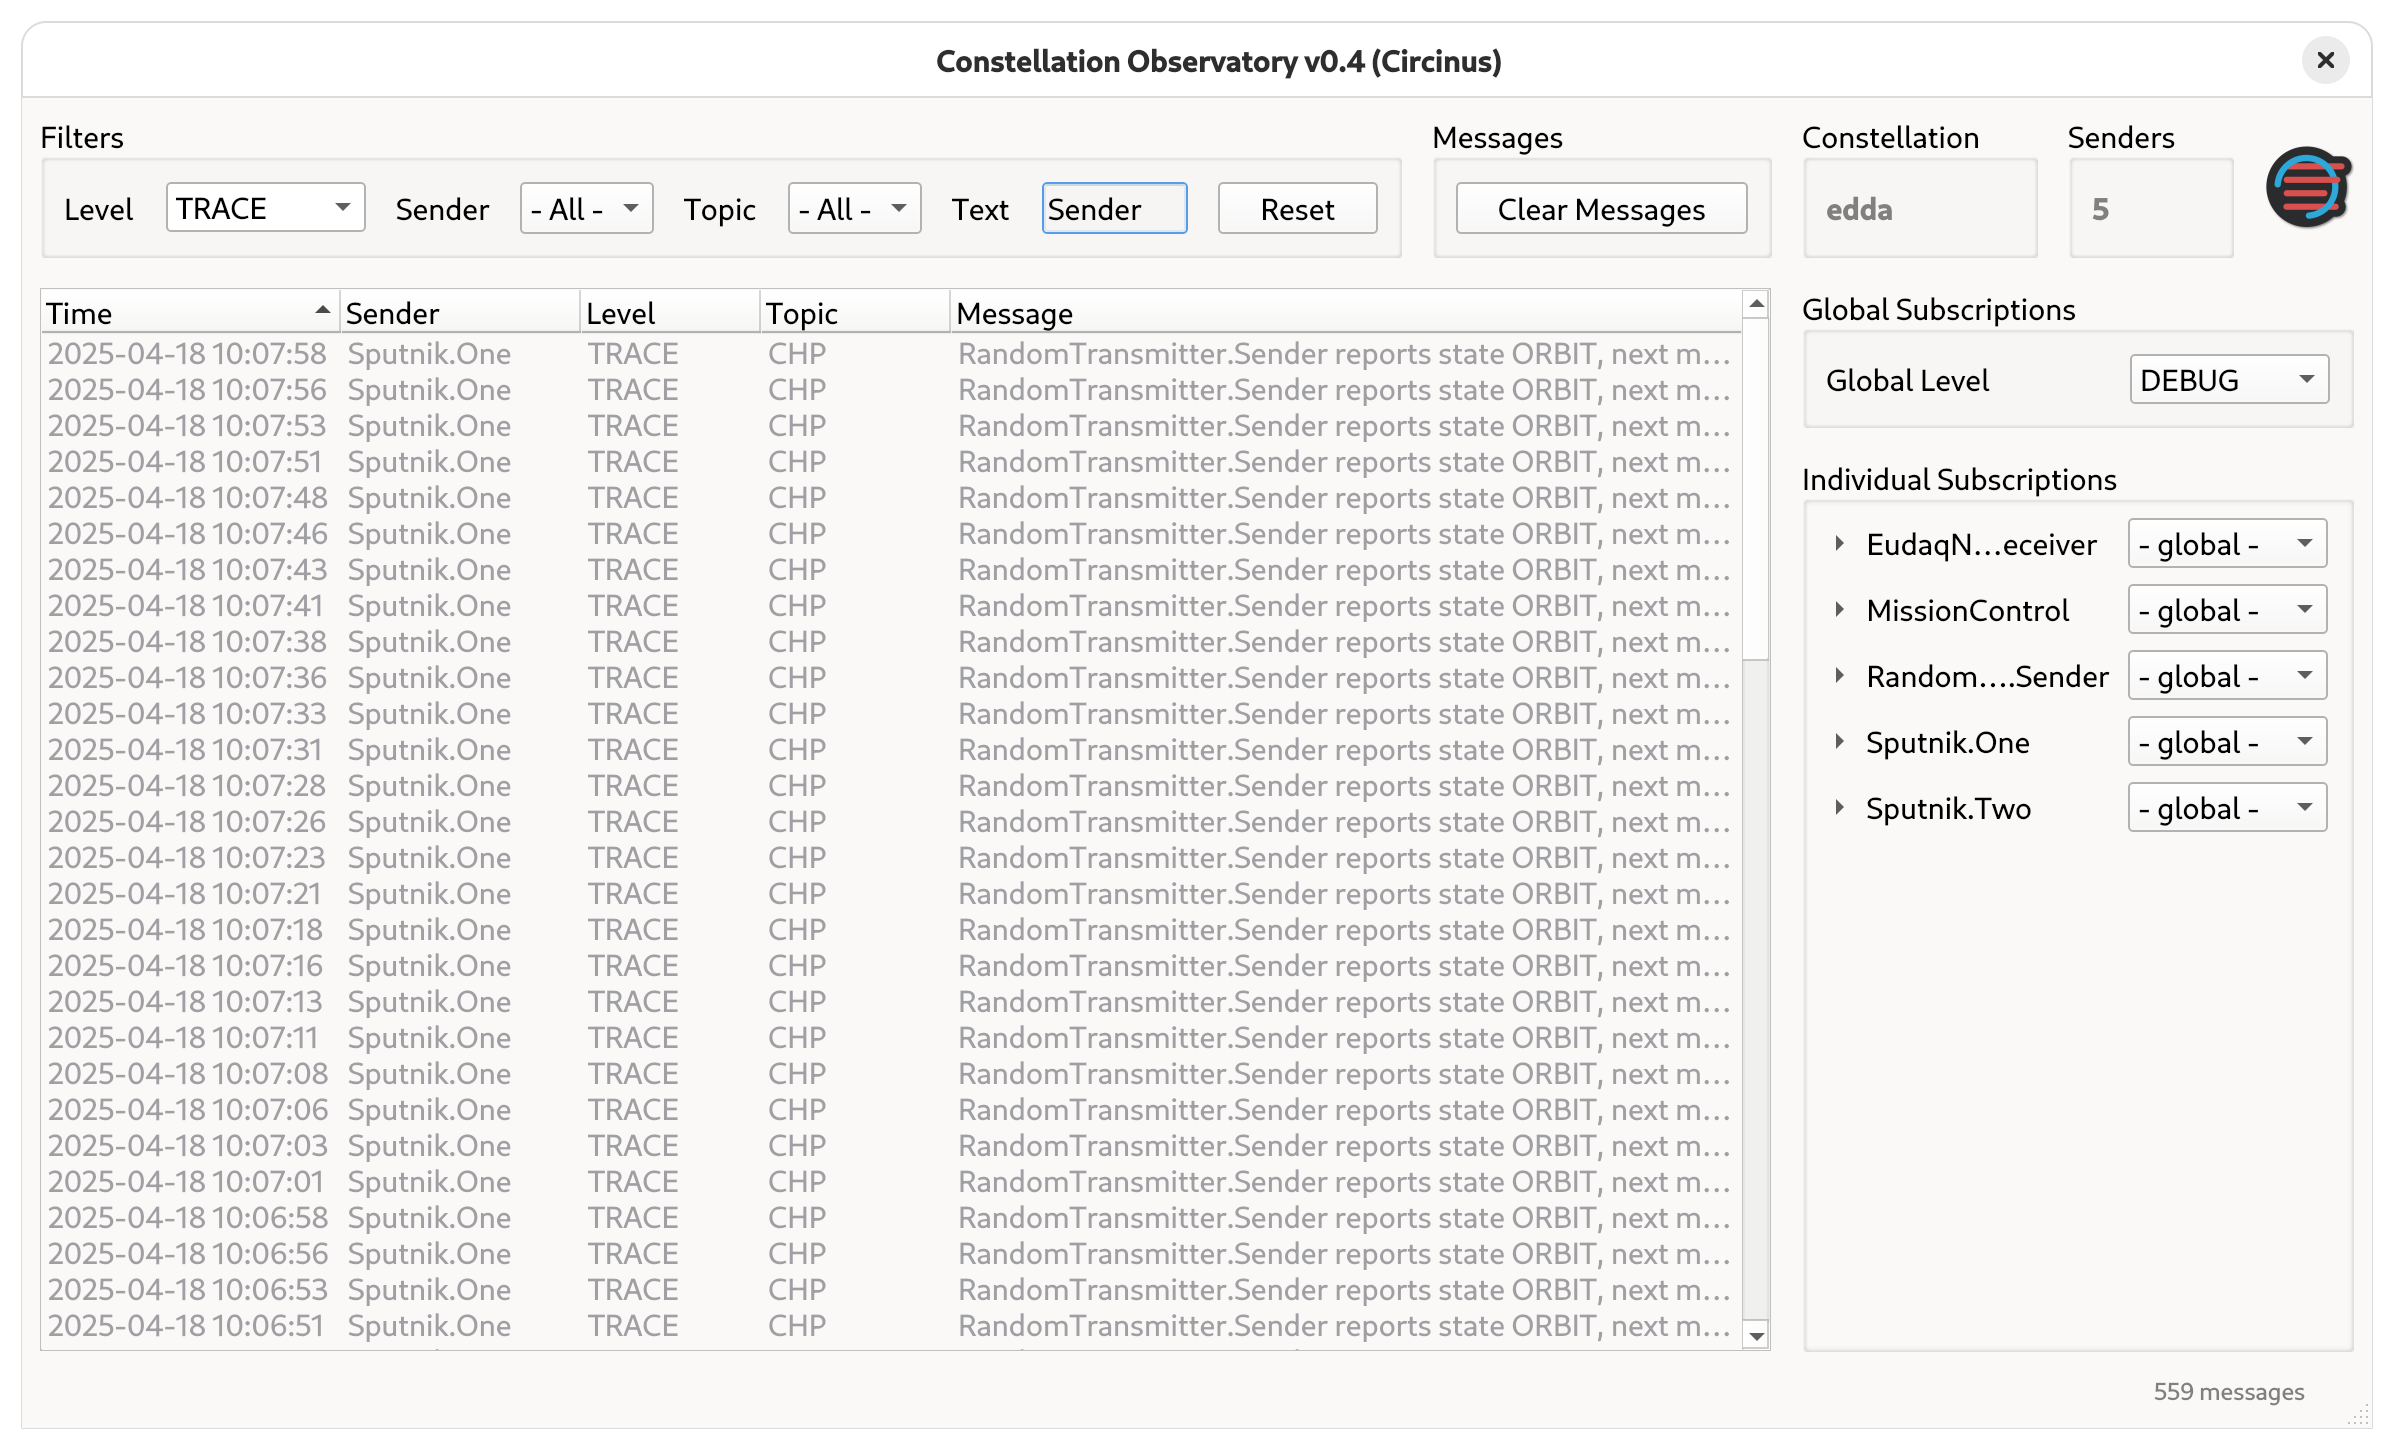
Figure 17 Observatory main window with message filtering by matching text#
Filters can be applied simultaneously. For example, it is possible to filter for all log messages with level WARNING or
higher from RandomTransmitter.Sender with the log topic FSM as shown in as done in Figure 18.
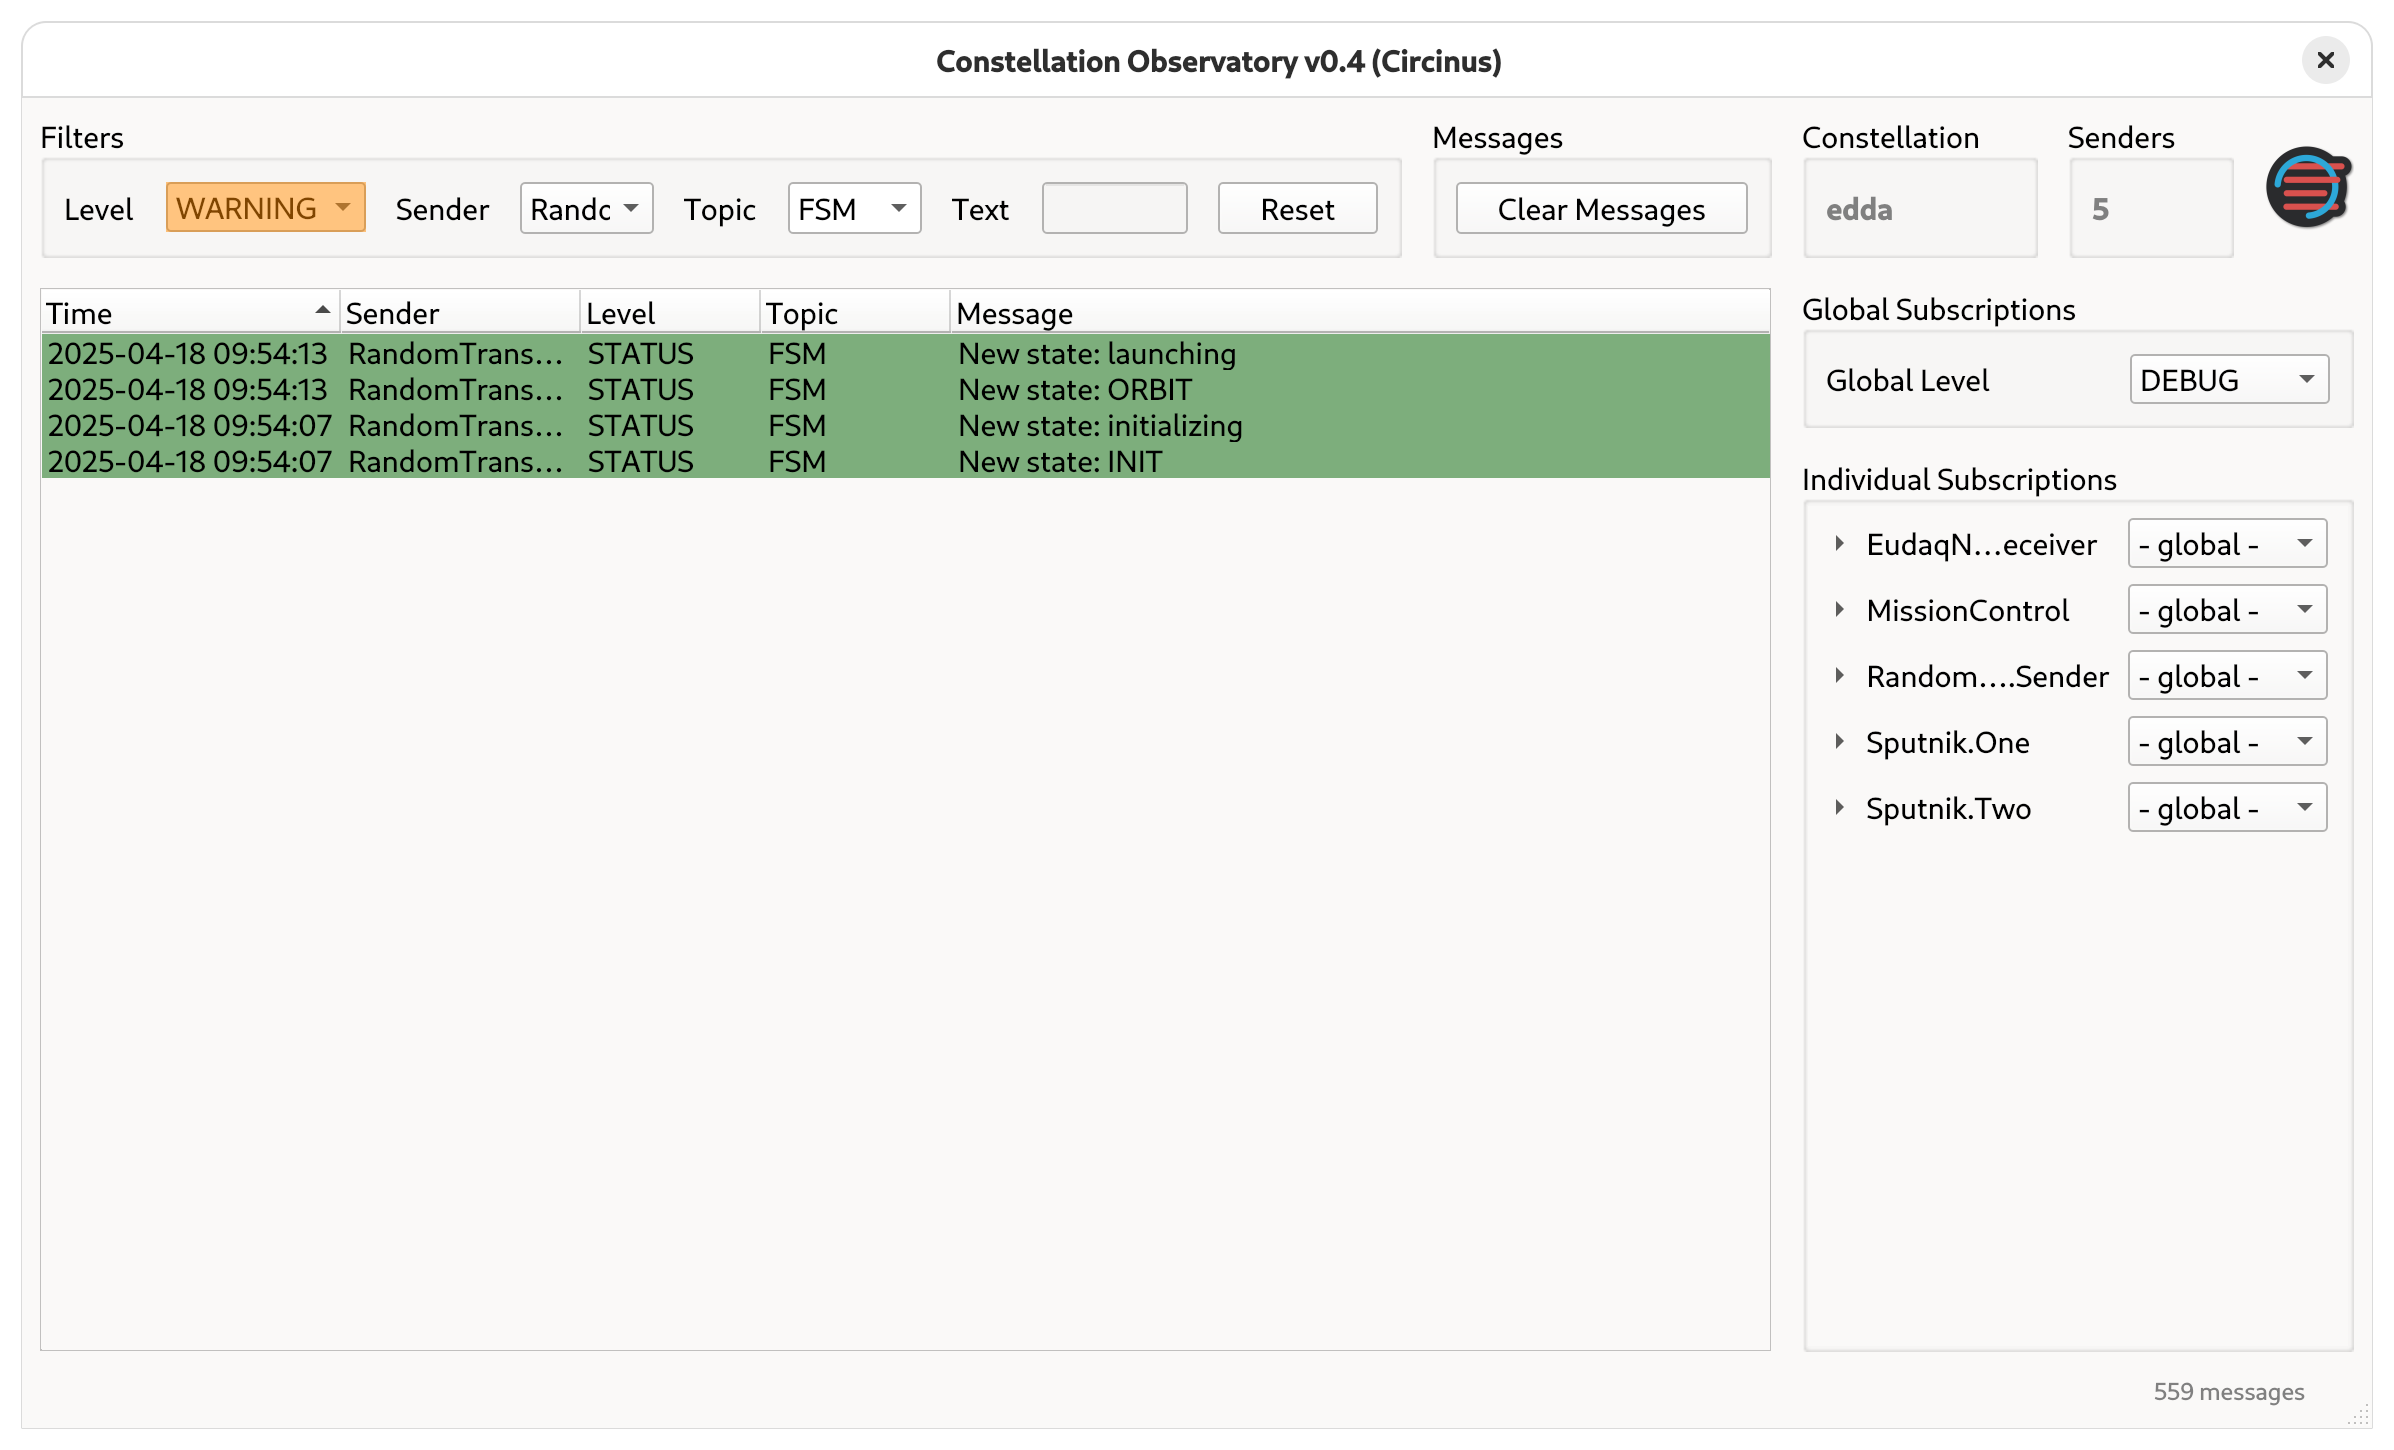
Figure 18 Observatory main window with message filtering by log level, sender and log topic#
All filters can be reset by clicking the Reset button next to the text filter.