Setting up InfluxDB and Grafana#
Online monitoring with telemetry is essential for most data taking operations. This monitoring data can be nicely displayed in a browser with Grafana in combination with a time series database like InfluxDB.
Setting up Docker Compose#
The easiest way to set up InfluxDB and Grafana is with Docker Compose. Installation instructions for Docker and the Docker
Compose plugin can be found on the Docker website. Alternatively, since Docker is
not trivial to set up and requires root, podman-docker together with podman-compose can be used instead if available in
the distribution repositories.
A file named docker-compose.yaml needs to be created with the following content:
services:
  influxdb:
    image: docker.io/library/influxdb:2
    container_name: influxdb
    ports:
      - "8086:8086"
    volumes:
      - influxdb-config:/etc/influxdb2
      - influxdb-data:/var/lib/influxdb2

  grafana:
    image: docker.io/grafana/grafana-oss
    container_name: grafana
    ports:
      - "3000:3000"
    depends_on:
      - influxdb
    volumes:
      - grafana-storage:/var/lib/grafana

volumes:
  influxdb-config:
  influxdb-data:
  grafana-storage:
Then the containers can be started with:
docker compose up -d
The containers can be stopped with:
docker compose down
Setting up InfluxDB#
InfluxDB can be accessed via http://localhost:8086.
When first visiting the website, a page for setup appears:
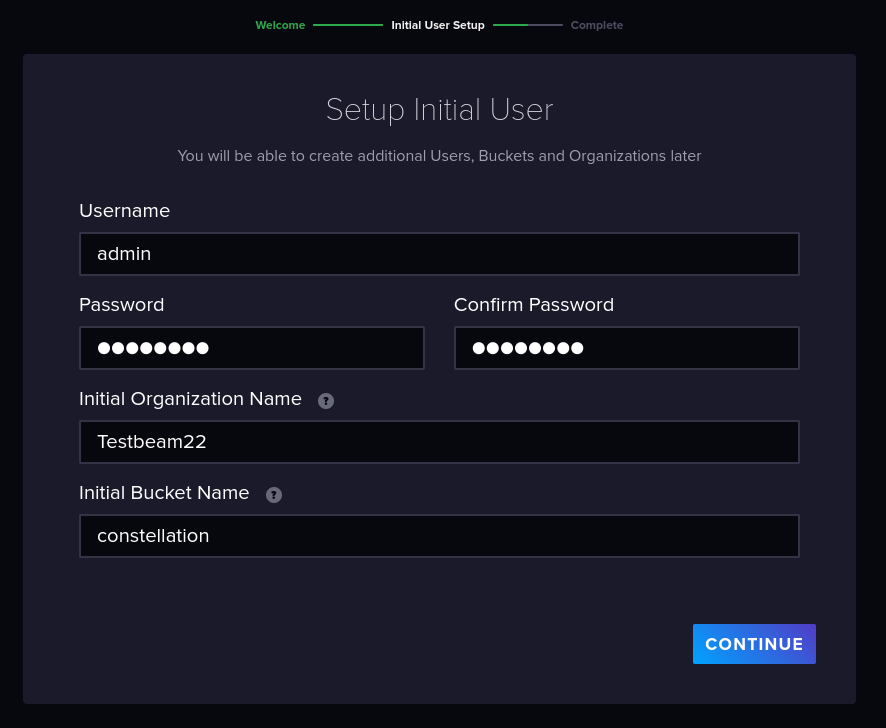
InfluxDB setup page#
Here, “constellation” as should be chosen as the initial bucket name.
After clicking “Continue”, a page with an API key appears. The API key should be copied for use in the Influx satellite,
then the configuration can be finalized by clicking “Configure Later”.
Tip
It is recommended to setup a maximum duration for which monitoring data is stored. This can be done by going to “Load Data” → “Buckets”, and then opening the settings for the “constellation” bucket.
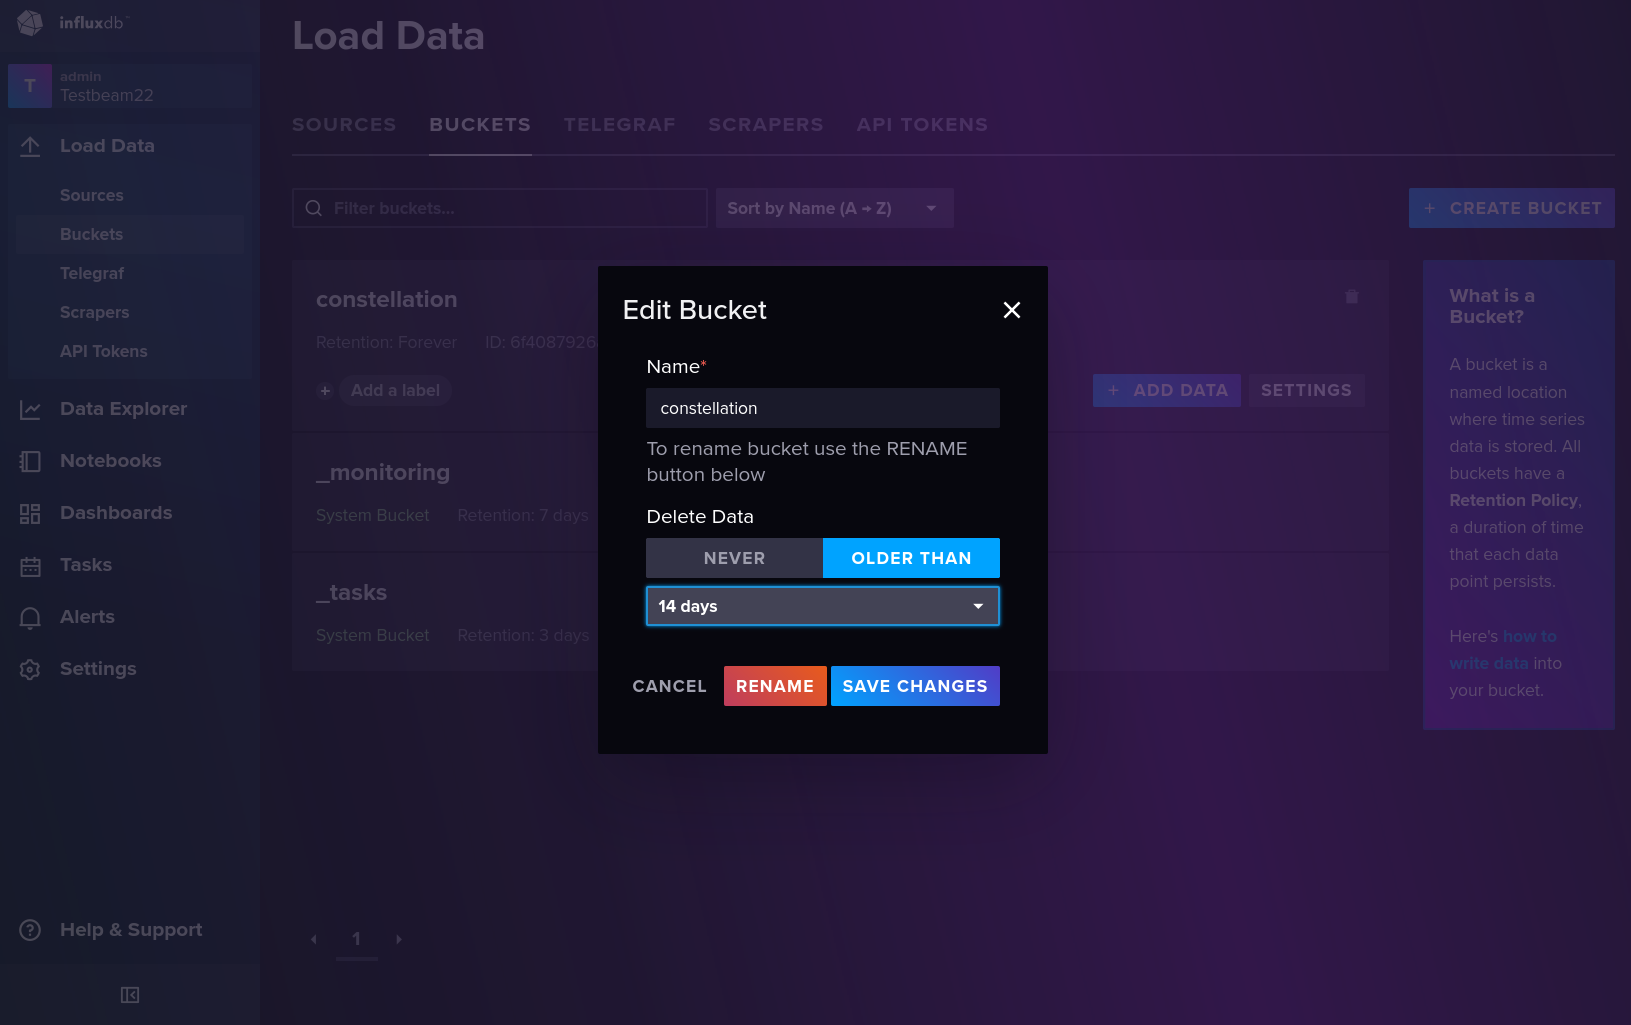
InfluxDB bucket settings#
Finally, it is recommended to create a custom API token for Grafana, that only reads from the “constellation” bucket. This can be done by going to “Load Data” → “API Token”, and clicking “Generate API Token” → “Custom API Token”.
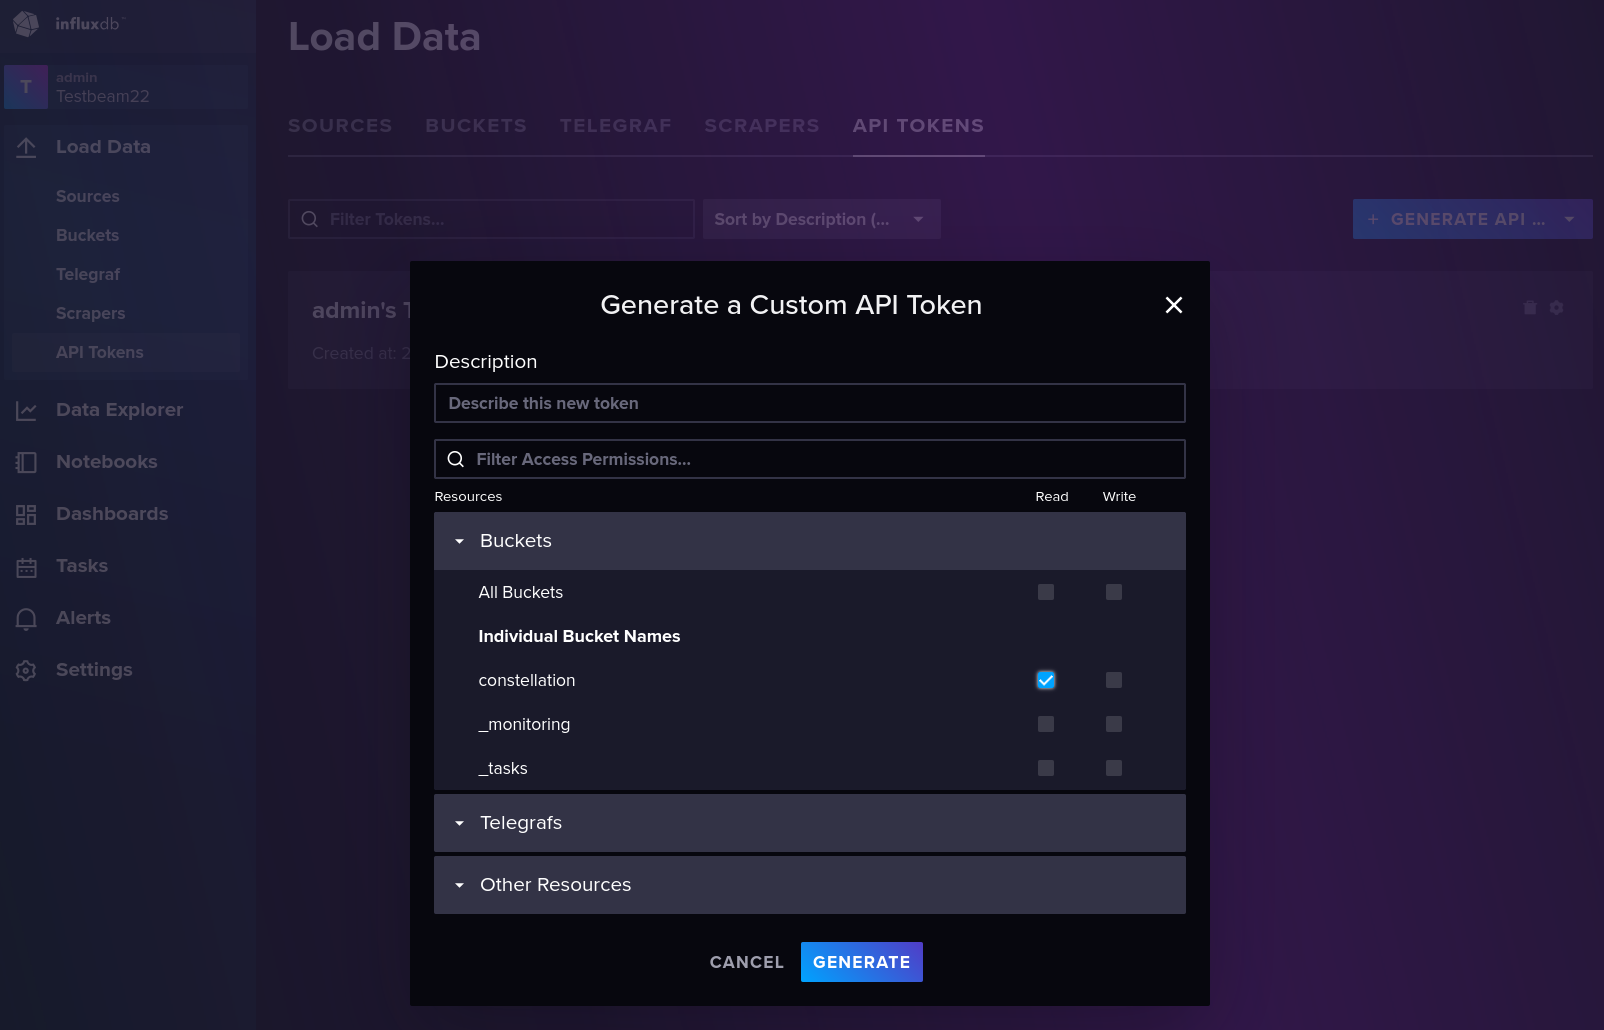
InfluxDB custom API token settings#
Setting up Grafana#
Grafana can be accessed via http://localhost:3000.
The default username and password are both admin.
First, InfluxDB needs to be added as a data source. This can be done by clicking on “Connections” → “Data sources” and then “Add data source”. On the page InfluxDB can be selected:
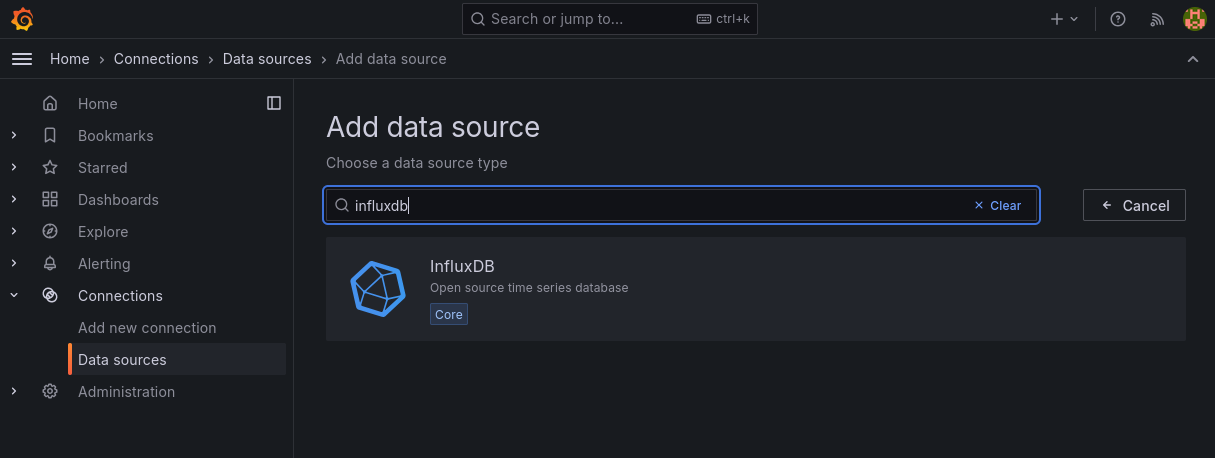
Grafana add data source#
On the configuration page, the following settings need to be adjusted:
Query language:FluxURL:http://influxdb:8086Organization: InfluxDB organization nameToken: Custom API token created for GrafanaDefault Bucket:constellationMin time interval:1s
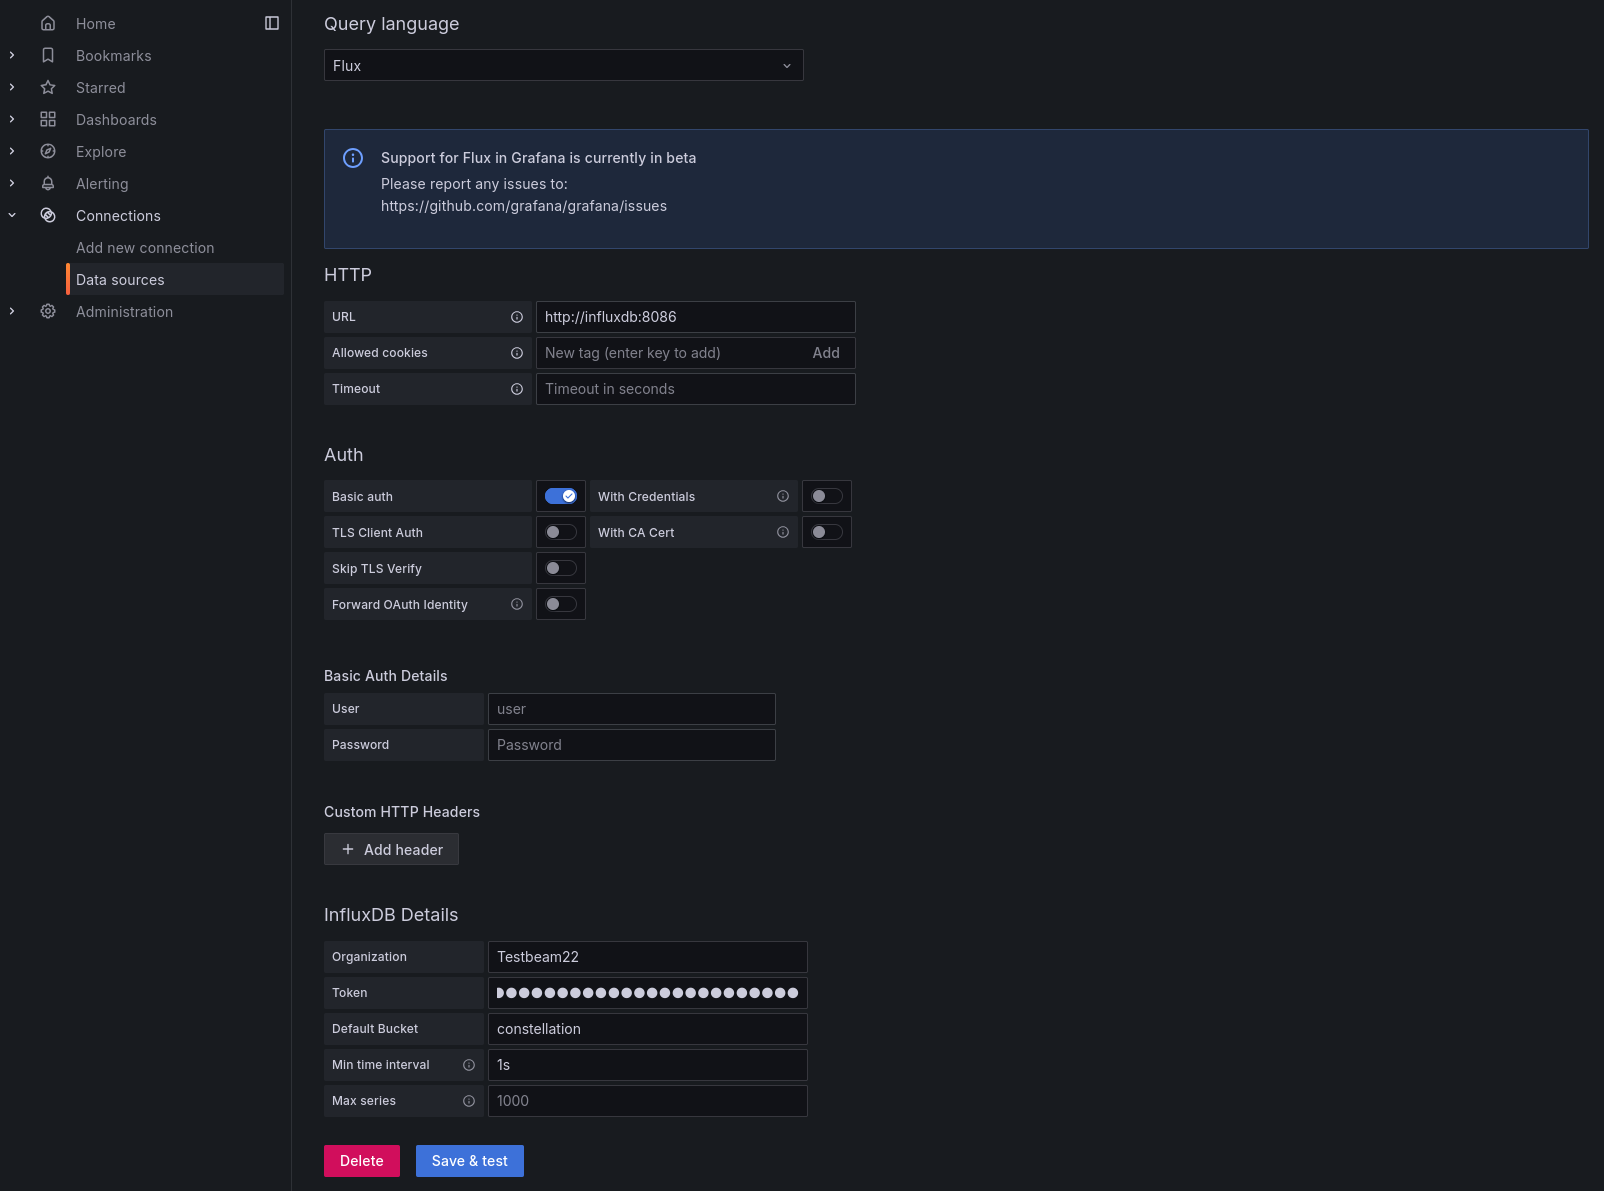
Grafana InfluxDB settings#
Adding a Dashboard#
To add a dashboard, monitoring data needs to be available. The Influx satellite can be used to
add monitoring data to InfluxDB. It requires the InfluxDB organization name and the API key shown during the setup phase.
Generating Monitoring Data#
For testing, the Mariner satellite can be used in combination with the Influx satellite.
The Mariner satellite can be started with:
SatelliteMariner -g edda -n Nine
The Influx satellite can be started with:
SatelliteInflux -g edda -n DB
The satellites need to be configured. A sample configuration might look like this:
[Mariner.Nine]
voltage = 1.0
current = 1.0
sample_period = 5.0

[Influx.DB]
org = "Insert organization name here"
token = "Insert read-write API token here"
Assuming the configuration is stored in config.toml, the CLI controller can be started with:
Controller -g edda -c config.toml
The satellites can be initialized with the configuration using:
constellation.initialize(cfg)
Now, the Mariner should send a BRIGHTNESS metric to the Influx satellite, which forwards it to the database.
Creating a Query#
To add a visualization in the dashboard, a Flux query needs to be made to the database. The easiest way to do this is using
the InfluxDB Data Explorer. There, the bucket (constellation), the measurement (sending satellite) and the filed (metric)
can be chosen. On the right, the aggregate function should be set to “last” and then the query can be submitted.
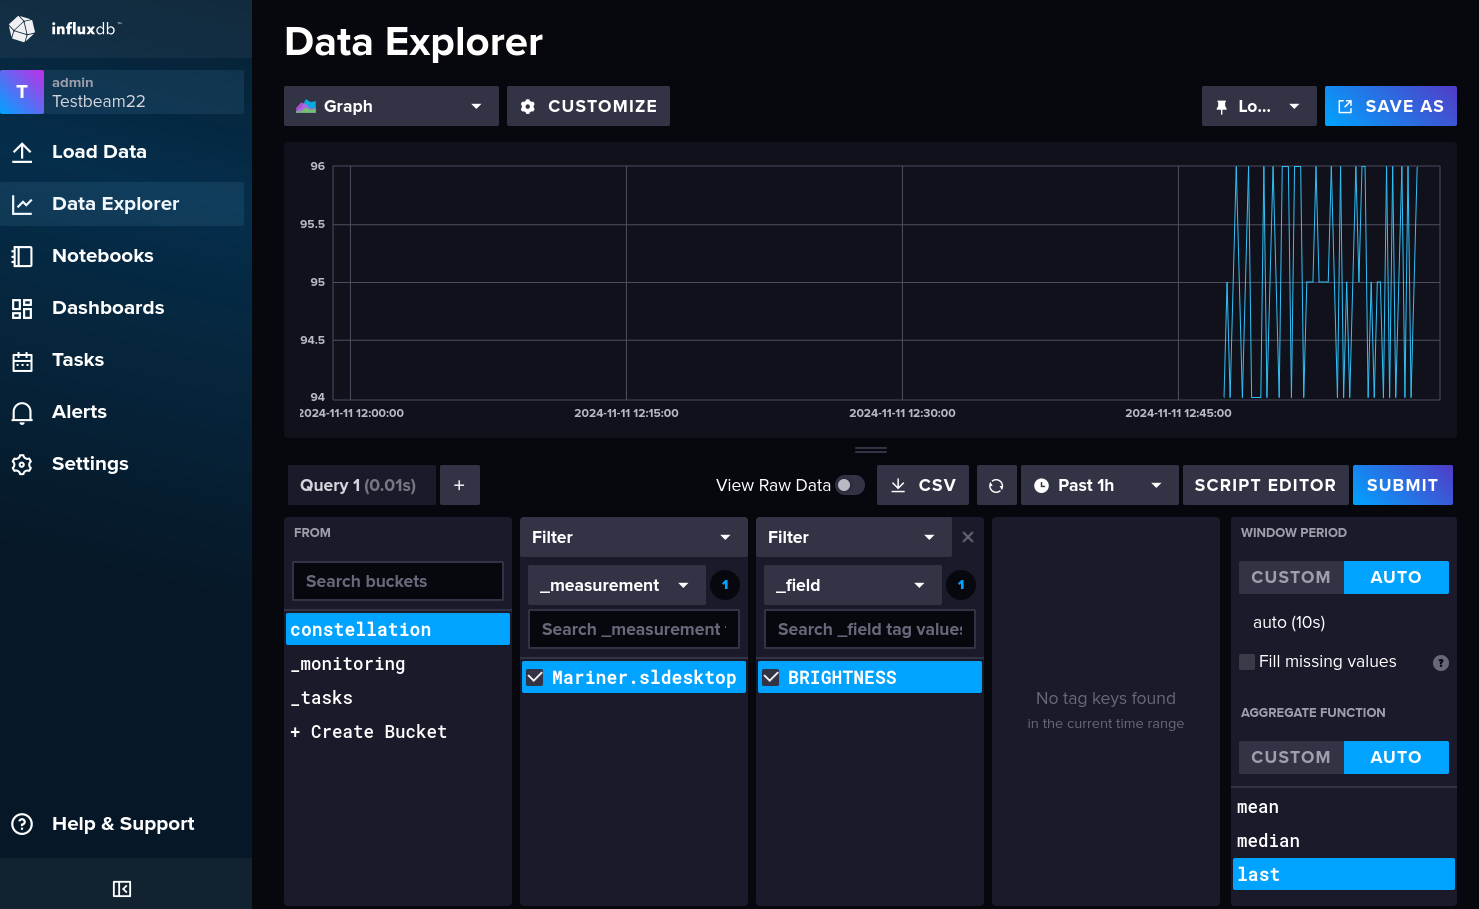
InfluxDB Query Builder#
The Flux query can be copied by switching to the “Script Editor”:
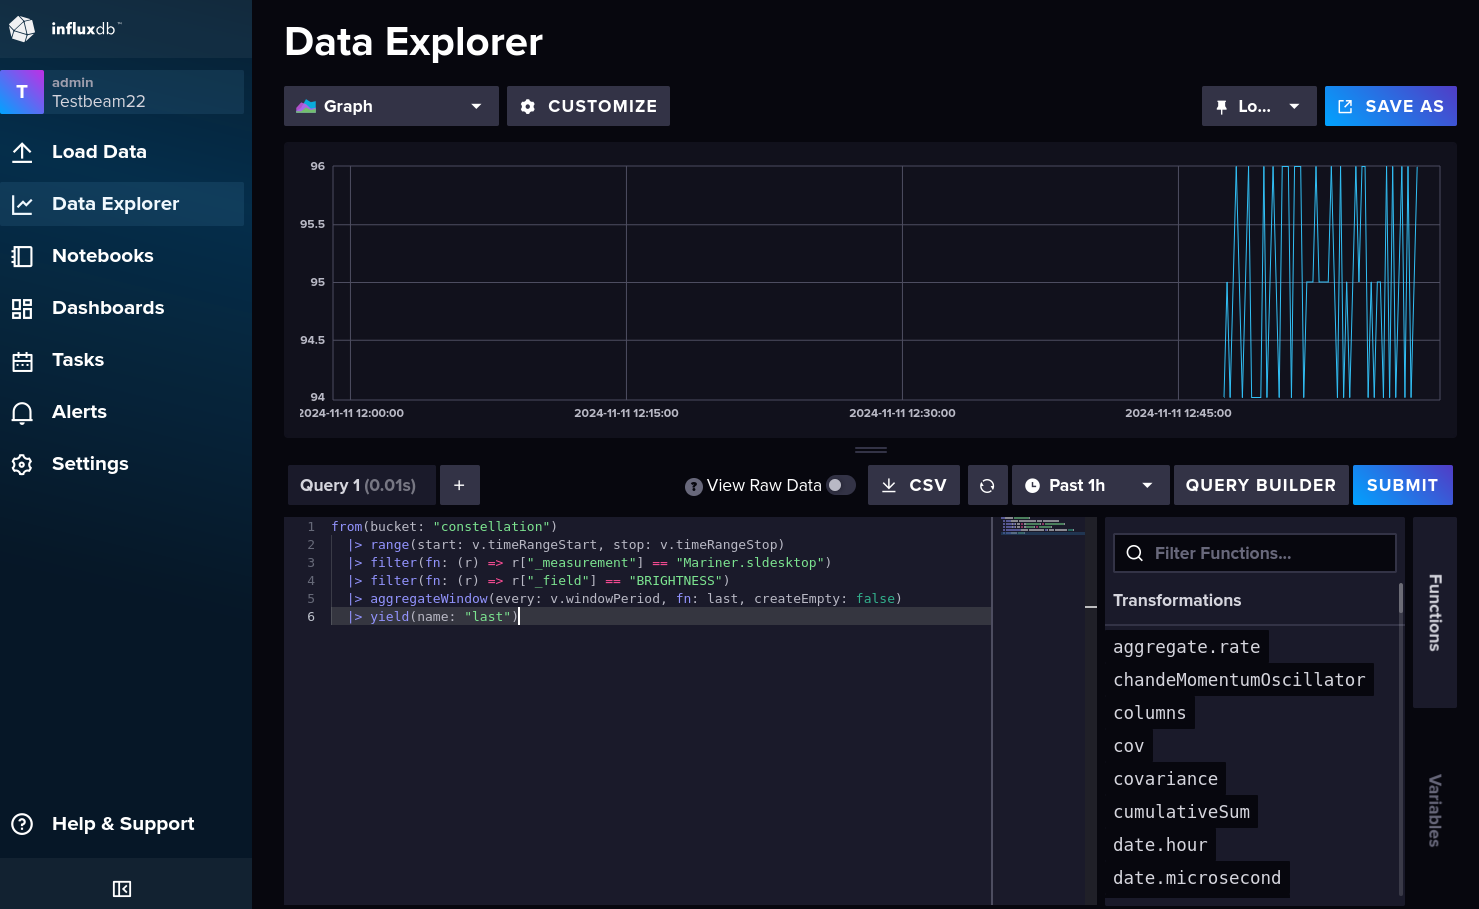
InfluxDB Script Editor#
Monitoring data can also be transformed in the Query for example to change the units.
To multiply a value by 0.01, this can be added in front of the yield part of the query:
|> map(fn: (r) => ({ r with _value: r._value * 0.01 }))
In this particular case with the Mariner satellite, this wouldn’t work since _value is an integer, which needs to be
transformed to a float first with float(v: r._value). The final query would then be:
from(bucket: "constellation")
  |> range(start: v.timeRangeStart, stop: v.timeRangeStop)
  |> filter(fn: (r) => r["_measurement"] == "Mariner.Nine")
  |> filter(fn: (r) => r["_field"] == "BRIGHTNESS")
  |> aggregateWindow(every: v.windowPeriod, fn: last, createEmpty: false)
  |> map(fn: (r) => ({ r with _value: float(v: r._value) * 0.01 }))
  |> yield(name: "last")
See also
For more details on creating queries, see InfluxDB’s Flux documentation.
Adding a Visualization#
First, a new dashboard needs to be created in Grafana by clicking on “Dashboards” and then “Create dashboard”. It should be noted that dashboards need to be saved manually, so it is recommend to directly save the new dashboard by clicking “Save dashboard” in the top right corner, where a title for dashboard can be given.
In the top right corner new visualizations can be added. After selecting InfluxDB, the visualization panel editor opens where the Flux query can be pasted:
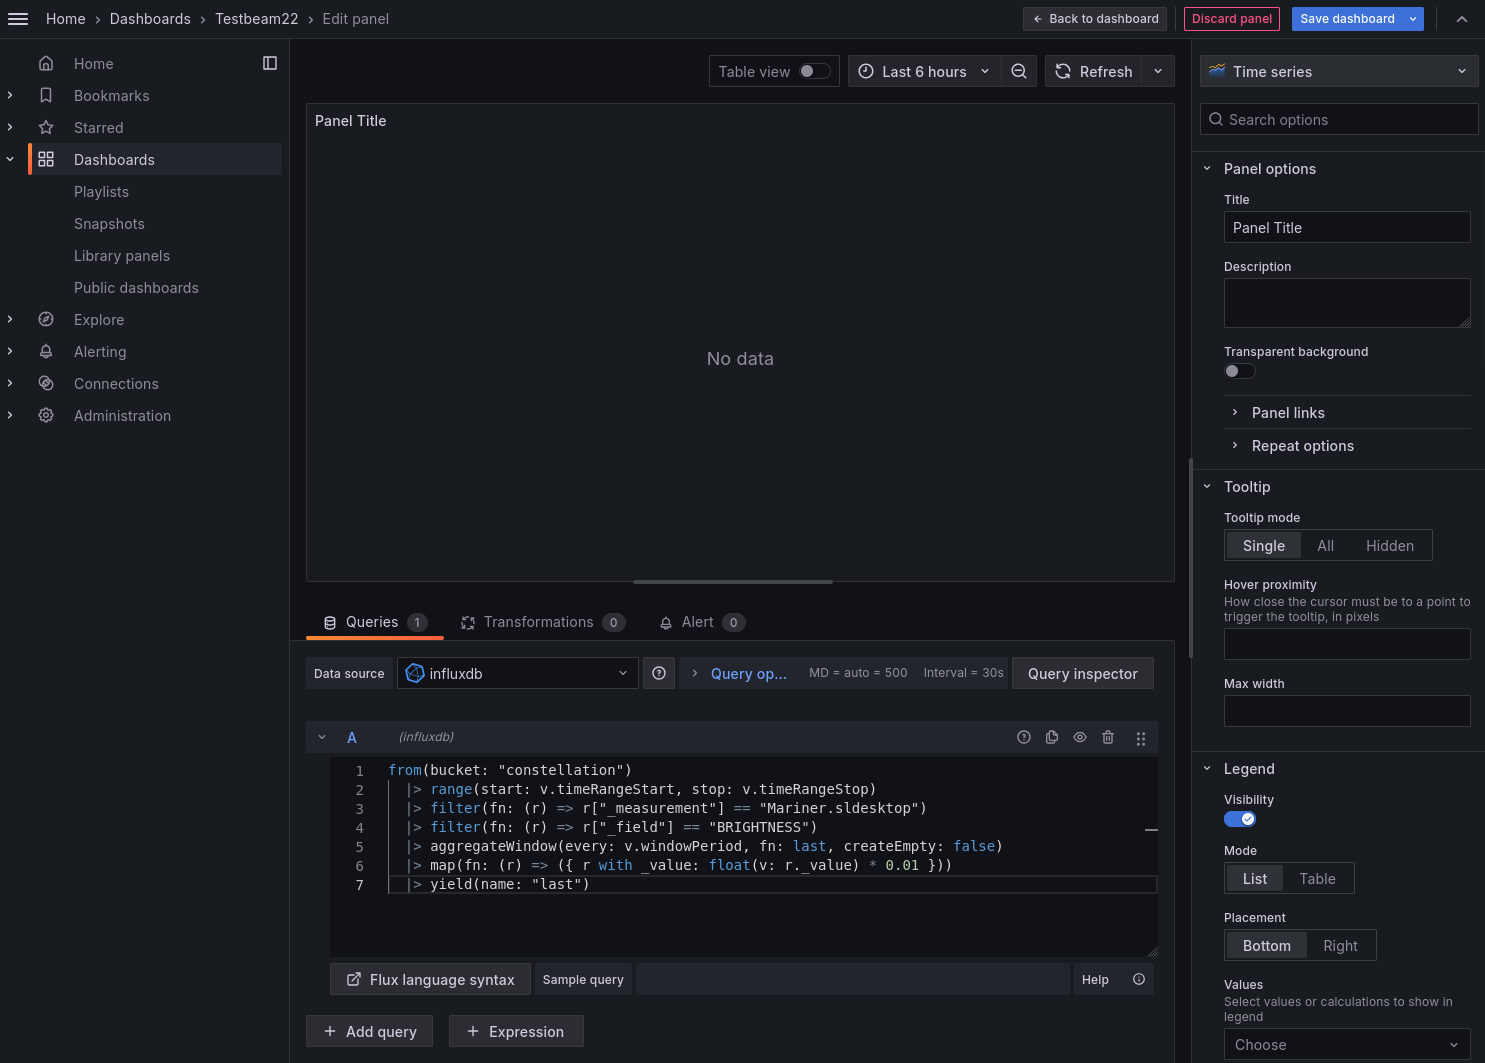
Grafana panel editor#
To get a first view of the monitoring data, the query needs to be refreshed by clicking “Refresh” above the panel. Left of the “Refresh” button, the time range can be adjusted. The panel can be further adjusted using the right side bar, for example with a proper title, a unit (under “Standard options”), showing the last value (under “Legend” → “Values”), adding a warning threshold, and not connecting values far apart (“Graph styles” → “Disconnected values”):
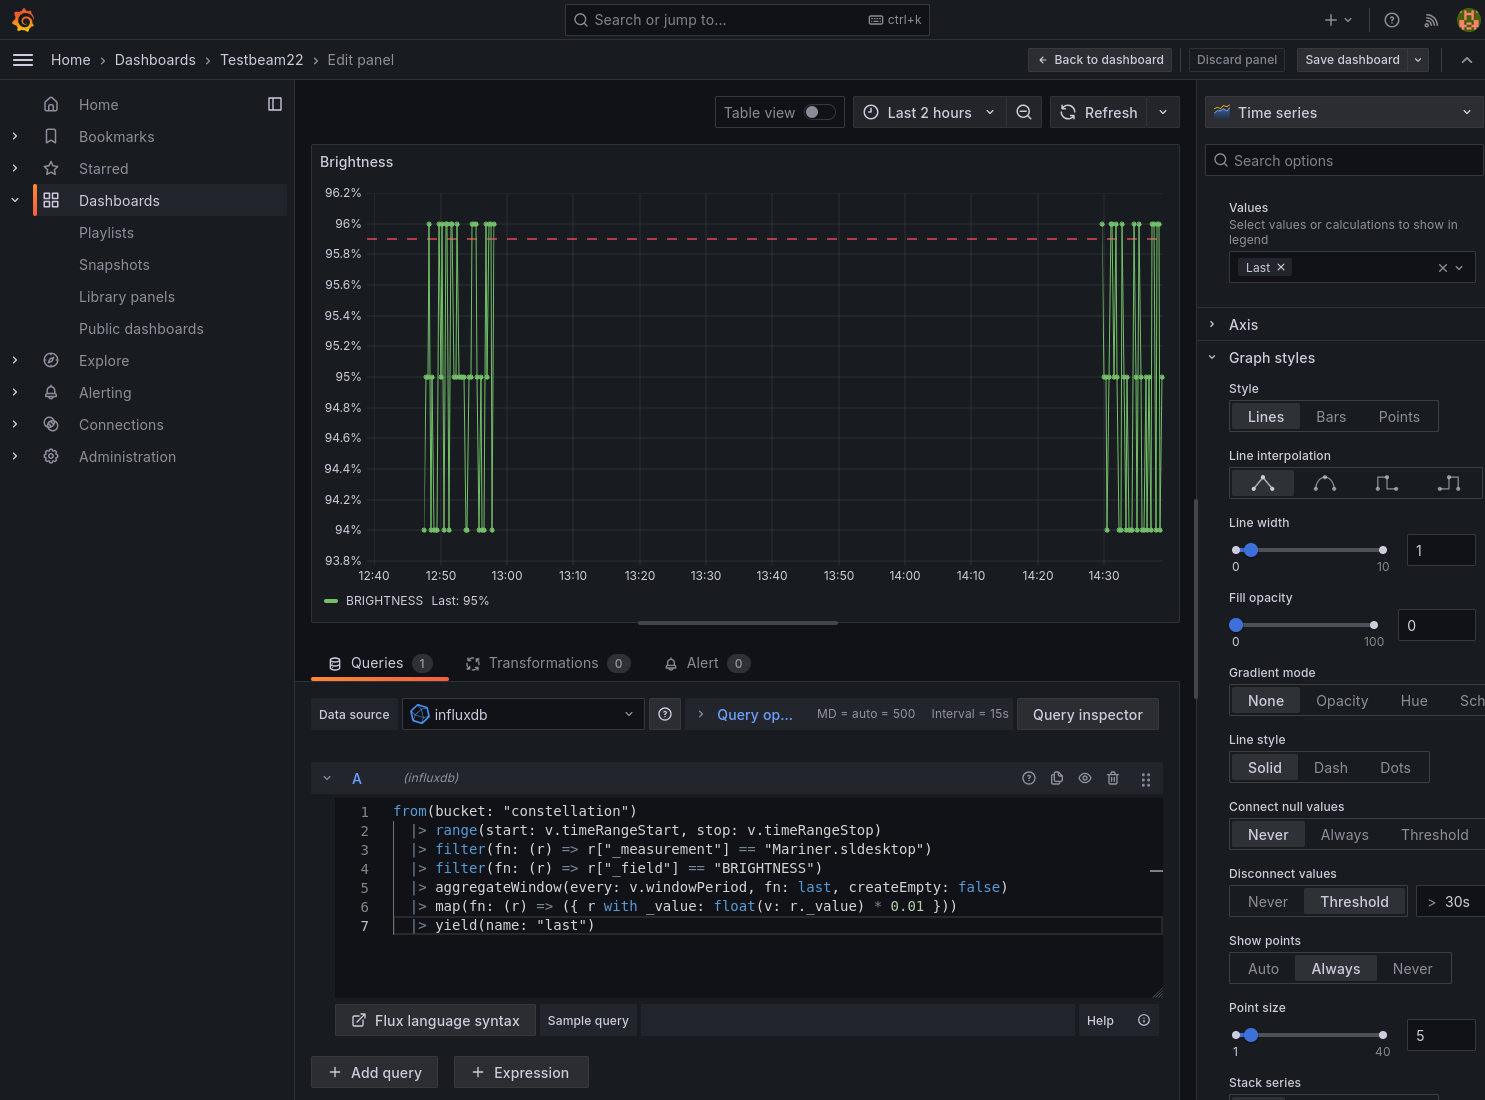
Grafana panel editor after edits#
Finally, the dashboard needs to be saved with the new panel. To automatically refresh the dashboard, the right triangle next to the “Refresh” button in dashboard overview can be extended to select a refresh interval:

Grafana dashboard#
